371 Crowells Bog Rd Brewster, MA 02631
Estimated Value: $2,704,000 - $4,417,000
7
Beds
5
Baths
4,516
Sq Ft
$801/Sq Ft
Est. Value
About This Home
This home is located at 371 Crowells Bog Rd, Brewster, MA 02631 and is currently estimated at $3,616,456, approximately $800 per square foot. 371 Crowells Bog Rd is a home located in Barnstable County with nearby schools including Stony Brook Elementary School, Eddy Elementary School, and Nauset Regional Middle School.
Ownership History
Date
Name
Owned For
Owner Type
Purchase Details
Closed on
Jan 3, 2017
Sold by
Marital T
Bought by
Ertel Shara R and Ertel Steven D
Current Estimated Value
Home Financials for this Owner
Home Financials are based on the most recent Mortgage that was taken out on this home.
Original Mortgage
$1,000,000
Outstanding Balance
$494,777
Interest Rate
3.94%
Mortgage Type
Unknown
Estimated Equity
$3,121,679
Purchase Details
Closed on
Jan 11, 2016
Sold by
Est Cox Jeanine F and Vigoda Robert A
Bought by
Jeanine F Cox T and Bednarczuk Lewis F
Purchase Details
Closed on
Jan 4, 2007
Sold by
Nancy W Greenwald Ret
Bought by
Cox Jeanine and Bednarczuk Lewis
Purchase Details
Closed on
Sep 11, 2000
Sold by
Dorsey Patrick B
Bought by
Nancy W Greenwald Ret and Greenald Roger Thell
Create a Home Valuation Report for This Property
The Home Valuation Report is an in-depth analysis detailing your home's value as well as a comparison with similar homes in the area
Home Values in the Area
Average Home Value in this Area
Purchase History
| Date | Buyer | Sale Price | Title Company |
|---|---|---|---|
| Ertel Shara R | $1,980,000 | -- | |
| Jeanine F Cox T | -- | -- | |
| Cox Jeanine | $1,775,000 | -- | |
| Nancy W Greenwald Ret | $295,000 | -- |
Source: Public Records
Mortgage History
| Date | Status | Borrower | Loan Amount |
|---|---|---|---|
| Open | Ertel Shara R | $1,000,000 |
Source: Public Records
Tax History Compared to Growth
Tax History
| Year | Tax Paid | Tax Assessment Tax Assessment Total Assessment is a certain percentage of the fair market value that is determined by local assessors to be the total taxable value of land and additions on the property. | Land | Improvement |
|---|---|---|---|---|
| 2025 | $23,208 | $3,373,200 | $1,089,600 | $2,283,600 |
| 2024 | $21,860 | $3,210,000 | $1,027,900 | $2,182,100 |
| 2023 | $20,079 | $2,872,500 | $917,600 | $1,954,900 |
| 2022 | $19,013 | $2,422,100 | $764,400 | $1,657,700 |
| 2021 | $18,069 | $2,105,900 | $664,500 | $1,441,400 |
| 2020 | $17,711 | $2,054,600 | $664,500 | $1,390,100 |
| 2019 | $6,265 | $1,935,800 | $594,100 | $1,341,700 |
| 2018 | $15,308 | $1,853,300 | $548,400 | $1,304,900 |
| 2017 | $5,426 | $1,592,400 | $511,900 | $1,080,500 |
| 2016 | $12,884 | $1,528,300 | $502,000 | $1,026,300 |
| 2015 | $12,434 | $1,505,300 | $492,100 | $1,013,200 |
Source: Public Records
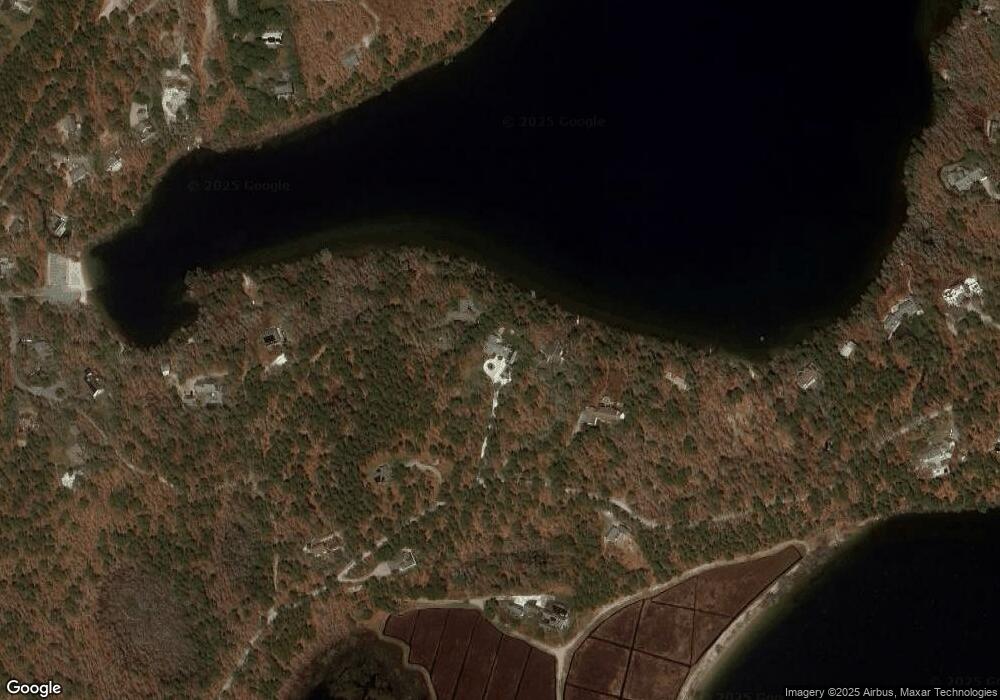
Map
Nearby Homes
- 55 Carlton Cir
- 663 Crowells Bog Rd
- 272 Sheep Pond Dr
- 242 Sheep Pond Dr
- 30 Fox Crossing Rd
- 26 Newport Rd
- 33 Captain William Arthur Rd
- 602 Tubman Rd
- 14 2nd St
- 958 Long Pond Rd
- 41 Great Oak Rd
- 48 Long Pond Dr
- 37 Oliver Dr
- 1437 Long Pond Rd
- 13 Harwich Pines
- 9 Park Ln
- 16 Long Pond Dr
- 43 Billington Ln Unit 43
- 43 Billington Ln
- 120 Red Maple Rd
- 385 Crowells Bog Rd
- 120 Storrow Dr
- 397 Crowells Bog Rd
- 365 Crowells Bog Rd
- 421 Crowells Bog Rd
- 410 Crowells Bog Rd
- 358 Crowells Bog Rd
- 91 Storrow Dr
- 91 Storrow Dr Unit 10
- 425 Crowells Bog Rd
- 341 Crowells Bog Rd
- 316 Crowells Bog Rd
- 0 Storrow Dr
- 65 Storrow Dr
- 491 Crowells Bog Rd
- 491 Crowell's Bog Rd
- 511 Crowells Bog Rd
- 130 Gulls Way
- 132 Gulls Way
- 59 Jollys Crossing Rd