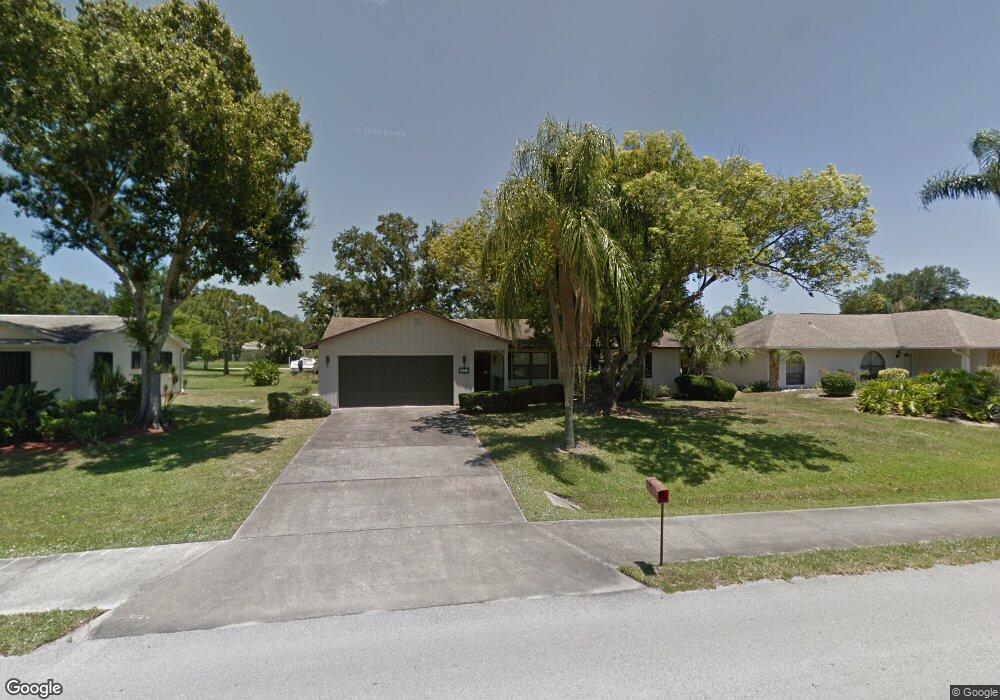
371 Fleming St Sebastian, FL 32958
Sebastian Highlands NeighborhoodEstimated Value: $274,949 - $306,000
3
Beds
2
Baths
1,256
Sq Ft
$234/Sq Ft
Est. Value
About This Home
This home is located at 371 Fleming St, Sebastian, FL 32958 and is currently estimated at $294,487, approximately $234 per square foot. 371 Fleming St is a home located in Indian River County with nearby schools including Sebastian Elementary School, Sebastian River Middle School, and Sebastian River High School.
Ownership History
Date
Name
Owned For
Owner Type
Purchase Details
Closed on
May 20, 2005
Sold by
Frost Douglas B and Frost Kelly M
Bought by
Frost Thelma M and Frost Douglas B
Current Estimated Value
Home Financials for this Owner
Home Financials are based on the most recent Mortgage that was taken out on this home.
Original Mortgage
$98,240
Outstanding Balance
$51,355
Interest Rate
5.88%
Mortgage Type
New Conventional
Estimated Equity
$243,132
Purchase Details
Closed on
May 16, 2005
Sold by
Frost Thelma M
Bought by
Frost Douglas B and Frost Kelly M
Home Financials for this Owner
Home Financials are based on the most recent Mortgage that was taken out on this home.
Original Mortgage
$98,240
Outstanding Balance
$51,355
Interest Rate
5.88%
Mortgage Type
New Conventional
Estimated Equity
$243,132
Create a Home Valuation Report for This Property
The Home Valuation Report is an in-depth analysis detailing your home's value as well as a comparison with similar homes in the area
Home Values in the Area
Average Home Value in this Area
Purchase History
| Date | Buyer | Sale Price | Title Company |
|---|---|---|---|
| Frost Thelma M | -- | Commercial Title Svcs Inc | |
| Frost Douglas B | $122,800 | Commercial Title Svcs Inc |
Source: Public Records
Mortgage History
| Date | Status | Borrower | Loan Amount |
|---|---|---|---|
| Open | Frost Douglas B | $98,240 |
Source: Public Records
Tax History Compared to Growth
Tax History
| Year | Tax Paid | Tax Assessment Tax Assessment Total Assessment is a certain percentage of the fair market value that is determined by local assessors to be the total taxable value of land and additions on the property. | Land | Improvement |
|---|---|---|---|---|
| 2024 | $3,027 | $222,737 | $56,100 | $166,637 |
| 2023 | $3,027 | $141,166 | $0 | $0 |
| 2022 | $2,704 | $195,451 | $39,100 | $156,351 |
| 2021 | $2,366 | $146,820 | $31,280 | $115,540 |
| 2020 | $2,221 | $135,654 | $25,840 | $109,814 |
| 2019 | $2,063 | $122,948 | $21,080 | $101,868 |
| 2018 | $1,959 | $114,206 | $18,700 | $95,506 |
| 2017 | $1,767 | $101,596 | $0 | $0 |
| 2016 | $1,659 | $91,500 | $0 | $0 |
| 2015 | $1,570 | $81,730 | $0 | $0 |
| 2014 | $1,293 | $59,880 | $0 | $0 |
Source: Public Records
Map
Nearby Homes
- 573 Alamanda Ave
- 425 Banyan St
- 502 Hibiscus Ave
- 572 Orange Ave
- 497 Alamanda Ave
- 649 Chesser Ave
- 258 Main St
- 517 Park Ave
- 000 River Run (Dock) Dr
- 450 Hazel St
- 486 Hazel St
- 367 Easy St
- 554 Gossamer Wing Way
- 502 Saunders St
- 109 Easy St
- 356 Toledo St
- 605 Monarch Way
- 471 Kumquat Ave
- 337 SW Mango Ave
- 401 Betty Ave