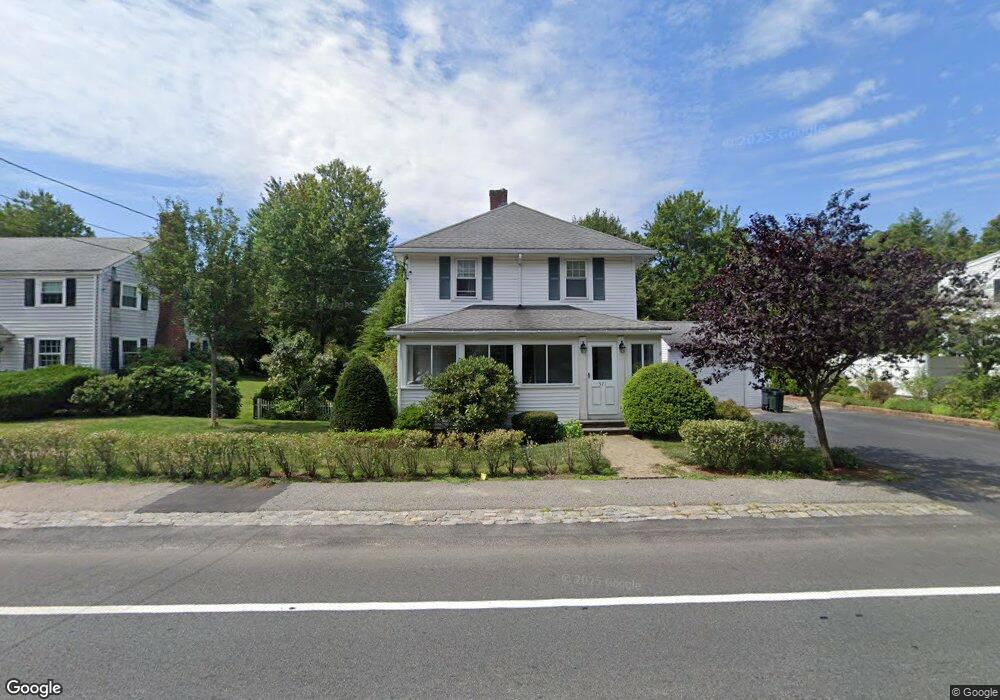
371 Front St Weymouth, MA 02188
Weymouth Landing NeighborhoodEstimated Value: $762,000 - $932,000
4
Beds
2
Baths
2,420
Sq Ft
$336/Sq Ft
Est. Value
About This Home
This home is located at 371 Front St, Weymouth, MA 02188 and is currently estimated at $813,016, approximately $335 per square foot. 371 Front St is a home located in Norfolk County with nearby schools including Frederick C Murphy, Abigail Adams Middle School, and Weymouth Middle School Chapman.
Ownership History
Date
Name
Owned For
Owner Type
Purchase Details
Closed on
Nov 28, 1994
Sold by
Oconnor Michael J and Oconnor Helen M
Bought by
Burke David M
Current Estimated Value
Home Financials for this Owner
Home Financials are based on the most recent Mortgage that was taken out on this home.
Original Mortgage
$133,200
Interest Rate
8.91%
Mortgage Type
Purchase Money Mortgage
Create a Home Valuation Report for This Property
The Home Valuation Report is an in-depth analysis detailing your home's value as well as a comparison with similar homes in the area
Home Values in the Area
Average Home Value in this Area
Purchase History
| Date | Buyer | Sale Price | Title Company |
|---|---|---|---|
| Burke David M | $148,000 | -- |
Source: Public Records
Mortgage History
| Date | Status | Borrower | Loan Amount |
|---|---|---|---|
| Open | Burke David M | $140,000 | |
| Closed | Burke David M | $145,000 | |
| Closed | Burke David M | $133,200 | |
| Previous Owner | Burke David M | $120,000 |
Source: Public Records
Tax History
| Year | Tax Paid | Tax Assessment Tax Assessment Total Assessment is a certain percentage of the fair market value that is determined by local assessors to be the total taxable value of land and additions on the property. | Land | Improvement |
|---|---|---|---|---|
| 2025 | $7,334 | $726,100 | $216,300 | $509,800 |
| 2024 | $7,113 | $692,600 | $206,100 | $486,500 |
| 2023 | $6,953 | $665,400 | $190,800 | $474,600 |
| 2022 | $6,744 | $588,500 | $176,700 | $411,800 |
| 2021 | $6,185 | $526,800 | $176,700 | $350,100 |
| 2020 | $5,801 | $486,700 | $176,700 | $310,000 |
| 2019 | $5,601 | $462,100 | $169,900 | $292,200 |
| 2018 | $5,459 | $436,700 | $161,800 | $274,900 |
| 2017 | $5,193 | $405,400 | $154,100 | $251,300 |
| 2016 | $5,036 | $393,400 | $148,200 | $245,200 |
| 2015 | $4,792 | $371,500 | $148,200 | $223,300 |
| 2014 | $4,627 | $347,900 | $137,900 | $210,000 |
Source: Public Records
Map
Nearby Homes
- 33 Congress St
- 107 Summer St
- 82 Lester Ln
- 15 Summer St
- 19 Vine St Unit 3
- 19 Vine St Unit 2
- 116 Greenvale Ave
- 11 Richmond St
- 25 Richmond St
- 46 Roosevelt Rd
- 122 Washington St Unit Twenty-two
- 747 Middle St
- 8 Tara Dr Unit 4
- 8 Tara Dr Unit 5
- 37 Lantern Ln
- 165 Lake Shore Dr
- 211 Roosevelt Rd
- 41 Lantern Ln
- 501 Commerce Dr Unit 2310
- 501 Commerce Dr Unit 4308
Your Personal Tour Guide
Ask me questions while you tour the home.