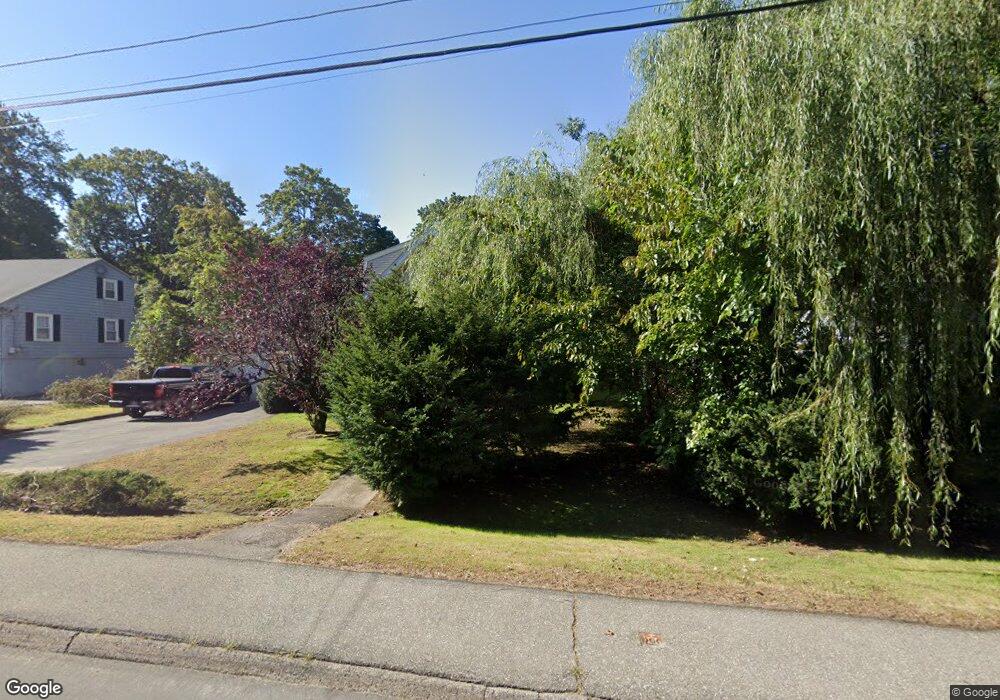
371 Greendale Ave Needham Heights, MA 02494
Estimated Value: $819,000 - $1,045,000
3
Beds
2
Baths
1,630
Sq Ft
$590/Sq Ft
Est. Value
About This Home
This home is located at 371 Greendale Ave, Needham Heights, MA 02494 and is currently estimated at $961,074, approximately $589 per square foot. 371 Greendale Ave is a home located in Norfolk County with nearby schools including Mitchell Elementary School, High Rock Middle School, and Pollard Middle School.
Ownership History
Date
Name
Owned For
Owner Type
Purchase Details
Closed on
Jan 3, 2008
Sold by
Setiabudi Gita K
Bought by
Setiabudi Gita K and Sato Misuzu
Current Estimated Value
Home Financials for this Owner
Home Financials are based on the most recent Mortgage that was taken out on this home.
Original Mortgage
$379,000
Interest Rate
6.27%
Mortgage Type
Purchase Money Mortgage
Purchase Details
Closed on
Jun 30, 2006
Sold by
Vintsevsky Yefim and Vintsevsky Yelena
Bought by
Setiabudi Gita K
Purchase Details
Closed on
May 1, 1996
Sold by
Langille Mary R
Bought by
Vintsevsky Yefim and Vintsevsky Yelena
Purchase Details
Closed on
Nov 22, 1994
Sold by
Hughes Kevin M and Hughes Maura K
Bought by
Langille Mary R
Purchase Details
Closed on
Mar 15, 1990
Sold by
Es Mancini Stella E
Bought by
Hughes Kevin M
Create a Home Valuation Report for This Property
The Home Valuation Report is an in-depth analysis detailing your home's value as well as a comparison with similar homes in the area
Home Values in the Area
Average Home Value in this Area
Purchase History
| Date | Buyer | Sale Price | Title Company |
|---|---|---|---|
| Setiabudi Gita K | -- | -- | |
| Setiabudi Gita K | -- | -- | |
| Setiabudi Gita K | -- | -- | |
| Setiabudi Gita K | $400,000 | -- | |
| Setiabudi Gita K | $400,000 | -- | |
| Vintsevsky Yefim | $187,500 | -- | |
| Vintsevsky Yefim | $187,500 | -- | |
| Langille Mary R | $8,000 | -- | |
| Langille Mary R | $8,000 | -- | |
| Hughes Kevin M | $145,000 | -- | |
| Hughes Kevin M | $145,000 | -- |
Source: Public Records
Mortgage History
| Date | Status | Borrower | Loan Amount |
|---|---|---|---|
| Open | Hughes Kevin M | $375,000 | |
| Closed | Setiabudi Gita K | $379,000 |
Source: Public Records
Tax History
| Year | Tax Paid | Tax Assessment Tax Assessment Total Assessment is a certain percentage of the fair market value that is determined by local assessors to be the total taxable value of land and additions on the property. | Land | Improvement |
|---|---|---|---|---|
| 2025 | $9,236 | $871,300 | $705,000 | $166,300 |
| 2024 | $7,675 | $613,000 | $475,500 | $137,500 |
| 2023 | $7,863 | $603,000 | $475,500 | $127,500 |
| 2022 | $7,259 | $542,900 | $417,900 | $125,000 |
| 2021 | $7,074 | $542,900 | $417,900 | $125,000 |
| 2020 | $6,687 | $535,400 | $417,900 | $117,500 |
| 2019 | $6,162 | $497,300 | $380,500 | $116,800 |
| 2018 | $5,908 | $497,300 | $380,500 | $116,800 |
| 2017 | $5,769 | $485,200 | $380,500 | $104,700 |
| 2016 | $5,599 | $485,200 | $380,500 | $104,700 |
| 2015 | $5,478 | $485,200 | $380,500 | $104,700 |
| 2014 | $5,225 | $448,900 | $346,500 | $102,400 |
Source: Public Records
Map
Nearby Homes
- 17 Lindbergh Ave
- 68 Brookline St
- 190 Brookline St
- 55 Burnside Rd
- 143 Hunting Rd
- 11 Holmes St
- 42 Woodbine Cir
- 5 Hazel Ln
- 14 Melrose Ave
- 176 Highgate St
- 510 Webster St
- 66 Upland Rd
- 108 Woodbine Cir
- 100 Woodbine Cir
- 7 West St
- 28 Mercer Rd
- 24 Mellen St
- 638 Webster St
- 638 Webster St Unit 638
- 674 Webster St
- 379 Greendale Ave
- 361 Greendale Ave
- 48 Rosalie Rd
- 16 Rosalie Rd
- 54 Rosalie Rd
- 1 Paul Revere Rd
- 42 Rosalie Rd
- 11 Paul Revere Rd
- 36 Rosalie Rd
- 351 Greendale Ave
- 17 Paul Revere Rd
- 15 Rosalie Rd
- 8 Paul Revere Rd
- 47 Rosalie Rd
- 23 Rosalie Rd
- 53 Rosalie Rd
- 25 Paul Revere Rd
- 24 Paul Revere Rd
- 33 Rosalie Rd
- 29 Rosalie Rd
Your Personal Tour Guide
Ask me questions while you tour the home.