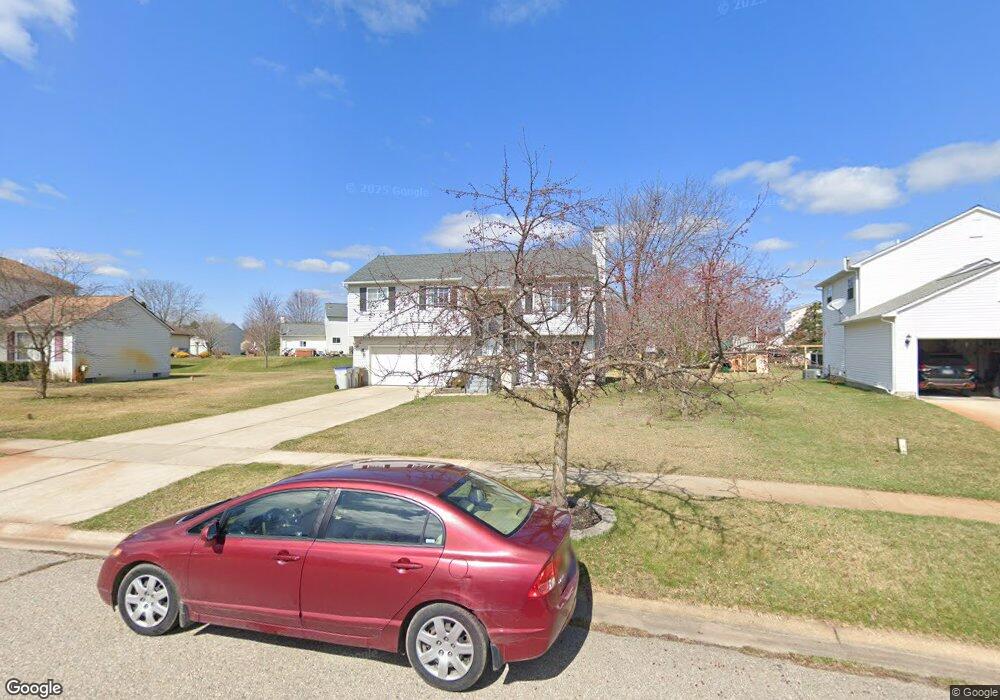
371 Ivylawn Unit 60 Whitmore Lake, MI 48189
Estimated Value: $322,446 - $372,000
3
Beds
2
Baths
1,464
Sq Ft
$236/Sq Ft
Est. Value
About This Home
This home is located at 371 Ivylawn Unit 60, Whitmore Lake, MI 48189 and is currently estimated at $344,862, approximately $235 per square foot. 371 Ivylawn Unit 60 is a home located in Washtenaw County with nearby schools including Whitmore Lake Elementary School, Whitmore Lake High School, and Livingston Classical Academy.
Ownership History
Date
Name
Owned For
Owner Type
Purchase Details
Closed on
Aug 19, 2011
Sold by
Long Brandon
Bought by
Fulkerson David and Fulkerson Melissa
Current Estimated Value
Purchase Details
Closed on
May 26, 2010
Sold by
Bank Of America Na
Bought by
Long Brandon
Purchase Details
Closed on
Jun 18, 2009
Sold by
Alent Eric and Alent Lisa M
Bought by
Bank Of America Na
Purchase Details
Closed on
Jul 25, 2001
Sold by
Frey Brent T
Bought by
Alent Eric
Purchase Details
Closed on
Nov 14, 1997
Sold by
Adler Building & Dev Co
Bought by
Frey Brent T and Frey Melissa D
Home Financials for this Owner
Home Financials are based on the most recent Mortgage that was taken out on this home.
Original Mortgage
$119,500
Interest Rate
7.46%
Mortgage Type
New Conventional
Create a Home Valuation Report for This Property
The Home Valuation Report is an in-depth analysis detailing your home's value as well as a comparison with similar homes in the area
Home Values in the Area
Average Home Value in this Area
Purchase History
| Date | Buyer | Sale Price | Title Company |
|---|---|---|---|
| Fulkerson David | $114,000 | Hometown One Title Agency Ll | |
| Long Brandon | $112,500 | Met | |
| Bank Of America Na | $169,823 | None Available | |
| Alent Eric | $172,000 | -- | |
| Frey Brent T | $125,790 | -- |
Source: Public Records
Mortgage History
| Date | Status | Borrower | Loan Amount |
|---|---|---|---|
| Previous Owner | Frey Brent T | $119,500 |
Source: Public Records
Tax History Compared to Growth
Tax History
| Year | Tax Paid | Tax Assessment Tax Assessment Total Assessment is a certain percentage of the fair market value that is determined by local assessors to be the total taxable value of land and additions on the property. | Land | Improvement |
|---|---|---|---|---|
| 2025 | $835 | $146,000 | $0 | $0 |
| 2024 | $811 | $134,200 | $0 | $0 |
| 2023 | $773 | $126,000 | $0 | $0 |
| 2022 | $2,909 | $111,400 | $0 | $0 |
| 2021 | $2,849 | $105,600 | $0 | $0 |
| 2020 | $2,821 | $99,200 | $0 | $0 |
| 2019 | $2,752 | $92,200 | $92,200 | $0 |
| 2018 | $2,678 | $96,900 | $0 | $0 |
| 2017 | $2,555 | $95,000 | $0 | $0 |
| 2016 | $664 | $62,528 | $0 | $0 |
| 2015 | -- | $62,341 | $0 | $0 |
| 2014 | -- | $60,400 | $0 | $0 |
| 2013 | -- | $60,400 | $0 | $0 |
Source: Public Records
Map
Nearby Homes
- 8962 Sunflower Unit 49
- 9031 Posey Dr
- 371 E Shore Dr
- 9119 Garfield Dr
- 66 E Shore Dr
- 9510 Main St
- 9509 Main St
- 0 Margaret St
- 000 Jennings Rd
- 00 Jennings Rd
- 0000 Jennings Rd
- 320 Barker Rd
- 11994 N Main St
- 0 Six Mile Unit 25038336
- 0 Six Mile Unit 20251054704
- 0 Six Mile Unit 20251006647
- 0 Jennings Rd Unit 25041037
- 11731 Valerie Ln
- 435 Eight Mile Rd
- 326 Emerald Cir S
- 369 Ivylawn
- 373 Ivylawn
- 9041 Posey Dr Unit 58
- 296 Waterlily Unit 54
- 298 Waterlily
- 367 Ivylawn
- 294 Waterlily Unit 53
- 370 Ivylawn
- 9043 Posey Dr Unit 57
- 300 Waterlily Unit Bldg-Unit
- 300 Waterlily Unit 56
- 368 Ivylawn
- 9040 Posey Dr
- 292 Waterlily Unit 52
- 365 Ivylawn
- 9035 Posey Dr
- 9044 Posey Dr
- 375 Ivylawn Unit 80
- 366 Ivylawn Unit 77
- 363 Ivylawn Unit 64