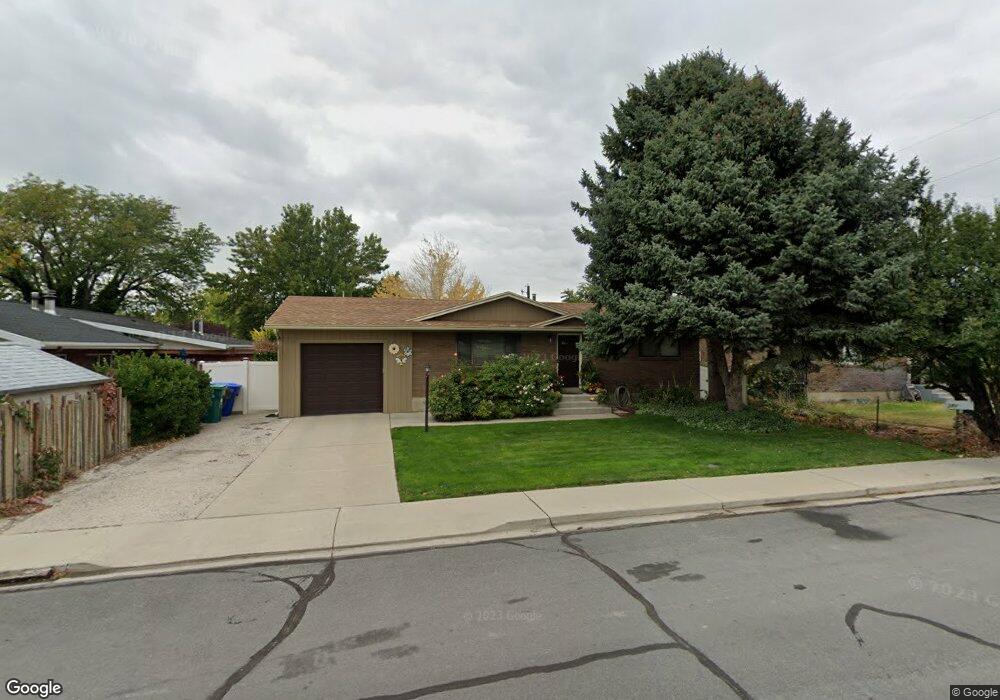
371 N 100 E Orem, UT 84057
Sharon NeighborhoodEstimated Value: $504,000 - $513,011
3
Beds
4
Baths
1,240
Sq Ft
$410/Sq Ft
Est. Value
About This Home
This home is located at 371 N 100 E, Orem, UT 84057 and is currently estimated at $508,670, approximately $410 per square foot. 371 N 100 E is a home located in Utah County with nearby schools including Cascade Elementary School, Canyon View Junior High School, and Orem High School.
Ownership History
Date
Name
Owned For
Owner Type
Purchase Details
Closed on
May 15, 2023
Sold by
Fugal Niels Isaac
Bought by
Fugal Family Revocable Trust and Fugal
Current Estimated Value
Purchase Details
Closed on
Nov 13, 2020
Sold by
Stovall Dan B and Stovall Kimberly A
Bought by
Stovall Dan Bartholomew
Home Financials for this Owner
Home Financials are based on the most recent Mortgage that was taken out on this home.
Original Mortgage
$457,000
Interest Rate
2.8%
Mortgage Type
New Conventional
Purchase Details
Closed on
Jan 28, 2015
Sold by
Fugal Venice J
Bought by
Fugal Niels Isaac
Create a Home Valuation Report for This Property
The Home Valuation Report is an in-depth analysis detailing your home's value as well as a comparison with similar homes in the area
Home Values in the Area
Average Home Value in this Area
Purchase History
| Date | Buyer | Sale Price | Title Company |
|---|---|---|---|
| Fugal Family Revocable Trust | -- | None Listed On Document | |
| Stovall Dan Bartholomew | -- | Provo Land Title Company | |
| Fugal Niels Isaac | -- | None Available |
Source: Public Records
Mortgage History
| Date | Status | Borrower | Loan Amount |
|---|---|---|---|
| Previous Owner | Stovall Dan Bartholomew | $457,000 |
Source: Public Records
Tax History
| Year | Tax Paid | Tax Assessment Tax Assessment Total Assessment is a certain percentage of the fair market value that is determined by local assessors to be the total taxable value of land and additions on the property. | Land | Improvement |
|---|---|---|---|---|
| 2025 | $2,019 | $262,130 | -- | -- |
| 2024 | $2,019 | $246,895 | $0 | $0 |
| 2023 | $1,864 | $244,915 | $0 | $0 |
| 2022 | $1,821 | $231,880 | $0 | $0 |
| 2021 | $1,587 | $306,100 | $131,300 | $174,800 |
| 2020 | $1,458 | $276,400 | $105,000 | $171,400 |
| 2019 | $1,332 | $262,500 | $94,800 | $167,700 |
| 2018 | $1,265 | $238,200 | $84,600 | $153,600 |
| 2017 | $1,262 | $127,325 | $0 | $0 |
| 2016 | $1,090 | $101,420 | $0 | $0 |
| 2015 | $1,153 | $101,420 | $0 | $0 |
| 2014 | $1,127 | $98,725 | $0 | $0 |
Source: Public Records
Map
Nearby Homes
Your Personal Tour Guide
Ask me questions while you tour the home.