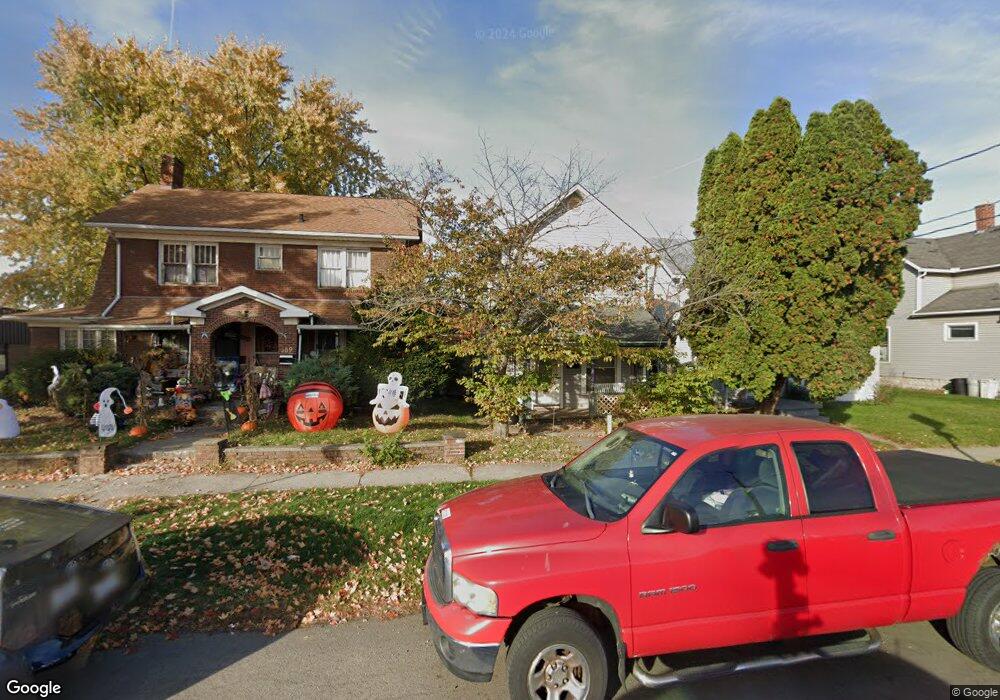
371 N Main St Marion, OH 43302
Estimated Value: $93,000 - $124,000
2
Beds
1
Bath
1,288
Sq Ft
$83/Sq Ft
Est. Value
About This Home
This home is located at 371 N Main St, Marion, OH 43302 and is currently estimated at $107,333, approximately $83 per square foot. 371 N Main St is a home located in Marion County with nearby schools including William H. Taft Elementary School, Ulysses S. Grant Middle School, and Harding High School.
Ownership History
Date
Name
Owned For
Owner Type
Purchase Details
Closed on
Apr 11, 2022
Sold by
Beartrax Llc
Bought by
Ryner Investments Llc
Current Estimated Value
Home Financials for this Owner
Home Financials are based on the most recent Mortgage that was taken out on this home.
Original Mortgage
$324,000
Outstanding Balance
$279,175
Interest Rate
3.76%
Mortgage Type
New Conventional
Estimated Equity
-$171,842
Purchase Details
Closed on
Jan 8, 2021
Sold by
Beartrax Llc
Bought by
Ryner Investments Llc
Home Financials for this Owner
Home Financials are based on the most recent Mortgage that was taken out on this home.
Original Mortgage
$200,000
Interest Rate
2.71%
Mortgage Type
Land Contract Argmt. Of Sale
Purchase Details
Closed on
Mar 6, 2014
Bought by
Beartrax Llc
Purchase Details
Closed on
Aug 2, 1999
Bought by
Beartrax Llc
Purchase Details
Closed on
Dec 24, 1997
Bought by
Beartrax Llc
Create a Home Valuation Report for This Property
The Home Valuation Report is an in-depth analysis detailing your home's value as well as a comparison with similar homes in the area
Home Values in the Area
Average Home Value in this Area
Purchase History
| Date | Buyer | Sale Price | Title Company |
|---|---|---|---|
| Ryner Investments Llc | $220,000 | -- | |
| Ryner Investments Llc | $220,000 | None Available | |
| Beartrax Llc | -- | -- | |
| Beartrax Llc | -- | -- | |
| Beartrax Llc | $14,000 | -- |
Source: Public Records
Mortgage History
| Date | Status | Borrower | Loan Amount |
|---|---|---|---|
| Open | Ryner Investments Llc | $324,000 | |
| Previous Owner | Ryner Investments Llc | $200,000 |
Source: Public Records
Tax History
| Year | Tax Paid | Tax Assessment Tax Assessment Total Assessment is a certain percentage of the fair market value that is determined by local assessors to be the total taxable value of land and additions on the property. | Land | Improvement |
|---|---|---|---|---|
| 2025 | $724 | $21,800 | $2,140 | $19,660 |
| 2024 | $724 | $18,840 | $2,020 | $16,820 |
| 2023 | $724 | $18,840 | $2,020 | $16,820 |
| 2022 | $672 | $18,840 | $2,020 | $16,820 |
| 2021 | $630 | $15,890 | $1,760 | $14,130 |
| 2020 | $849 | $15,890 | $1,760 | $14,130 |
| 2019 | $881 | $15,890 | $1,760 | $14,130 |
| 2018 | $763 | $13,020 | $1,760 | $11,260 |
| 2017 | $808 | $13,020 | $1,760 | $11,260 |
| 2016 | $520 | $13,020 | $1,760 | $11,260 |
| 2015 | $519 | $12,720 | $1,680 | $11,040 |
| 2014 | $735 | $12,720 | $1,680 | $11,040 |
| 2012 | $511 | $12,430 | $780 | $11,650 |
Source: Public Records
Map
Nearby Homes
- 434 N State St
- 350 Mary St
- 531 N Main St
- 532 N Prospect St
- 552 N Prospect St
- 343 Commercial St
- 212 Short St
- 393 E George St
- 178 Leader St
- 197 Harrison St
- 736 N Main St
- 136 Baker St Unit 4
- 324 W Church St
- 592 N Greenwood St
- 374 Nunin Ct
- 229 W Columbia St
- 321 W Columbia St
- 594 E George St
- 501 Roberts Ave
- 405 Toledo Ave
- 381 N Main St
- 375 N Main St
- 369 N Main St
- 387 N Main St
- 380 N Prospect St
- 376 N Prospect St Unit 378
- 386 N Prospect St
- 399 N Main St
- 368 N Main St
- 394 N Prospect St
- 133 W Mark St
- 139 W Mark St
- 390 N Prospect St
- 125 W Farming St
- 402 N Prospect St
- 131 W Farming St
- 124 W Mark St
- 332 N Prospect St
- 375 N Prospect St
- 355 N Prospect St
Your Personal Tour Guide
Ask me questions while you tour the home.