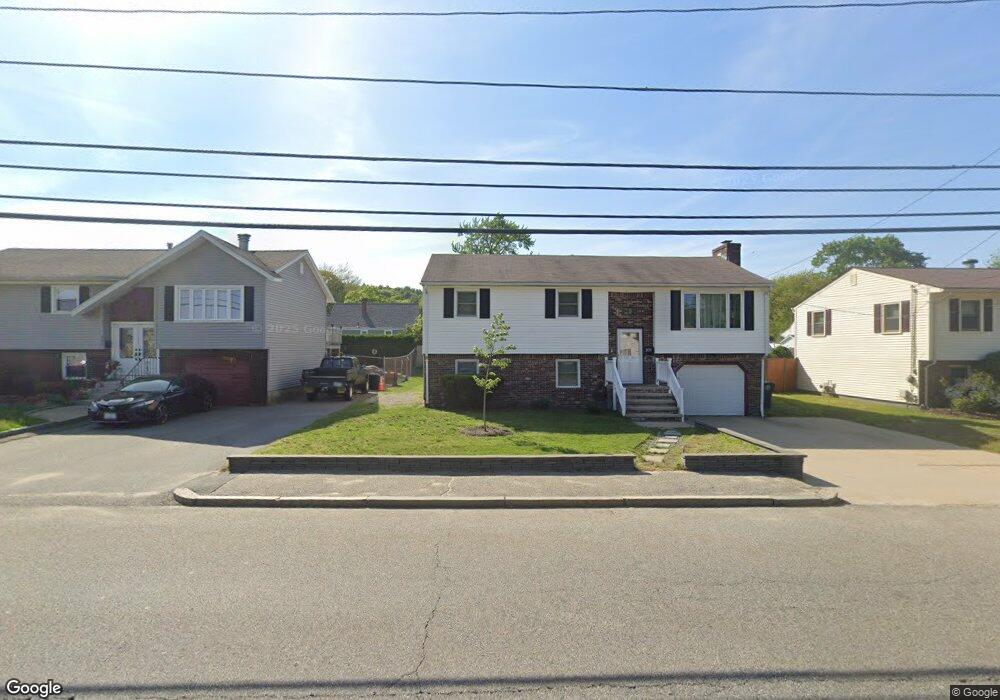
371 Phenix Ave Cranston, RI 02920
Comstock Gardens NeighborhoodEstimated Value: $388,889 - $437,000
3
Beds
1
Bath
1,230
Sq Ft
$332/Sq Ft
Est. Value
About This Home
This home is located at 371 Phenix Ave, Cranston, RI 02920 and is currently estimated at $408,722, approximately $332 per square foot. 371 Phenix Ave is a home located in Providence County with nearby schools including George J. Peters School, Western Hills Middle School, and Cranston High School West.
Ownership History
Date
Name
Owned For
Owner Type
Purchase Details
Closed on
Jun 30, 2021
Sold by
Tedesco Jane Est
Bought by
Lafond Ryan D and Monti Emily
Current Estimated Value
Home Financials for this Owner
Home Financials are based on the most recent Mortgage that was taken out on this home.
Original Mortgage
$238,426
Outstanding Balance
$213,975
Interest Rate
2.9%
Mortgage Type
Purchase Money Mortgage
Estimated Equity
$194,747
Create a Home Valuation Report for This Property
The Home Valuation Report is an in-depth analysis detailing your home's value as well as a comparison with similar homes in the area
Home Values in the Area
Average Home Value in this Area
Purchase History
| Date | Buyer | Sale Price | Title Company |
|---|---|---|---|
| Lafond Ryan D | $280,000 | None Available |
Source: Public Records
Mortgage History
| Date | Status | Borrower | Loan Amount |
|---|---|---|---|
| Open | Lafond Ryan D | $238,426 |
Source: Public Records
Tax History
| Year | Tax Paid | Tax Assessment Tax Assessment Total Assessment is a certain percentage of the fair market value that is determined by local assessors to be the total taxable value of land and additions on the property. | Land | Improvement |
|---|---|---|---|---|
| 2025 | $4,247 | $306,000 | $89,500 | $216,500 |
| 2024 | $4,165 | $306,000 | $89,500 | $216,500 |
| 2023 | $4,022 | $212,800 | $61,800 | $151,000 |
| 2022 | $3,939 | $212,800 | $61,800 | $151,000 |
| 2021 | $3,830 | $212,800 | $61,800 | $151,000 |
| 2020 | $3,813 | $183,600 | $48,000 | $135,600 |
| 2019 | $3,813 | $183,600 | $48,000 | $135,600 |
| 2018 | $3,725 | $183,600 | $48,000 | $135,600 |
| 2017 | $3,836 | $167,200 | $37,700 | $129,500 |
| 2016 | $3,754 | $167,200 | $37,700 | $129,500 |
| 2015 | $3,754 | $167,200 | $37,700 | $129,500 |
| 2014 | $3,257 | $142,600 | $37,700 | $104,900 |
Source: Public Records
Map
Nearby Homes
- 333 Phenix Ave
- 140 Lake View Rd
- 00 Burton St
- 178 Highland St
- 244 Stony Acre Dr
- 135 Meshanticut Valley Pkwy
- 105 Amy Dr
- 47 Bretton Woods Dr
- 93 Elena St
- 95 Amy Dr
- 54 Randall St
- 99 Salem Ave
- 29 Valley St
- 80 W View Ave
- 129 Vallette St
- 58 Meredith Dr
- 25 Janet Dr
- 214 Meshanticut Valley Pkwy
- 203 Dean Ridge Ct
- 19 Salem Ave
Your Personal Tour Guide
Ask me questions while you tour the home.