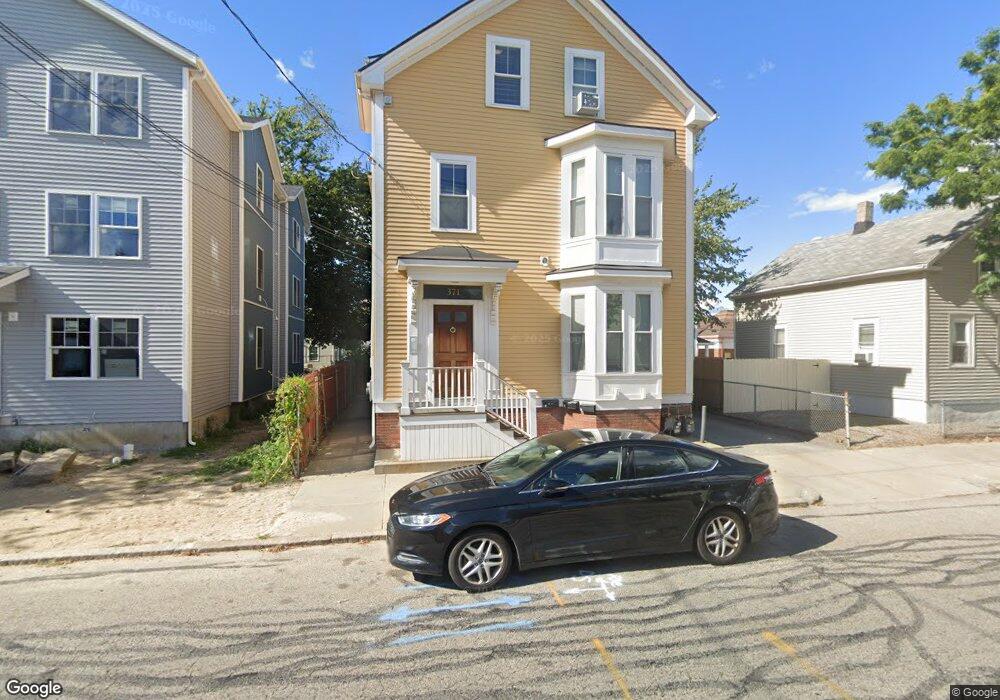
371 Public St Providence, RI 02905
Upper South Providence NeighborhoodEstimated Value: $491,000 - $616,997
6
Beds
3
Baths
2,517
Sq Ft
$220/Sq Ft
Est. Value
About This Home
This home is located at 371 Public St, Providence, RI 02905 and is currently estimated at $553,999, approximately $220 per square foot. 371 Public St is a home located in Providence County with nearby schools including Asa Messer Elementary School, Charles N. Fortes Elementary School, and Robert L. Bailey IV Elementary.
Ownership History
Date
Name
Owned For
Owner Type
Purchase Details
Closed on
Aug 20, 2009
Sold by
Nomura Credit
Bought by
Rhode Island Hsng
Current Estimated Value
Purchase Details
Closed on
Mar 2, 1999
Sold by
Diversfied Llc
Bought by
Tamarez Miguel A
Create a Home Valuation Report for This Property
The Home Valuation Report is an in-depth analysis detailing your home's value as well as a comparison with similar homes in the area
Home Values in the Area
Average Home Value in this Area
Purchase History
| Date | Buyer | Sale Price | Title Company |
|---|---|---|---|
| Rhode Island Hsng | $47,000 | -- | |
| Nomura Credit & Capital | -- | -- | |
| Tamarez Miguel A | $22,000 | -- | |
| Divesifield Llc | $8,000 | -- |
Source: Public Records
Mortgage History
| Date | Status | Borrower | Loan Amount |
|---|---|---|---|
| Open | Divesifield Llc | $5,997,900 | |
| Closed | Divesifield Llc | $450,000 | |
| Previous Owner | Divesifield Llc | $250,500 |
Source: Public Records
Tax History Compared to Growth
Tax History
| Year | Tax Paid | Tax Assessment Tax Assessment Total Assessment is a certain percentage of the fair market value that is determined by local assessors to be the total taxable value of land and additions on the property. | Land | Improvement |
|---|---|---|---|---|
| 2025 | $7,002 | $479,600 | $118,100 | $361,500 |
| 2024 | $5,960 | $324,800 | $74,800 | $250,000 |
| 2023 | $5,960 | $324,800 | $74,800 | $250,000 |
| 2022 | $5,781 | $324,800 | $74,800 | $250,000 |
| 2021 | $4,057 | $165,200 | $33,000 | $132,200 |
| 2020 | $4,057 | $165,200 | $33,000 | $132,200 |
| 2019 | $4,057 | $165,200 | $33,000 | $132,200 |
| 2018 | $3,695 | $115,600 | $30,000 | $85,600 |
| 2017 | $0 | $115,600 | $30,000 | $85,600 |
| 2016 | -- | $115,600 | $30,000 | $85,600 |
| 2015 | -- | $97,000 | $30,000 | $67,000 |
| 2014 | $3,453 | $97,000 | $30,000 | $67,000 |
| 2013 | $3,453 | $102,300 | $30,000 | $72,300 |
Source: Public Records
Map
Nearby Homes