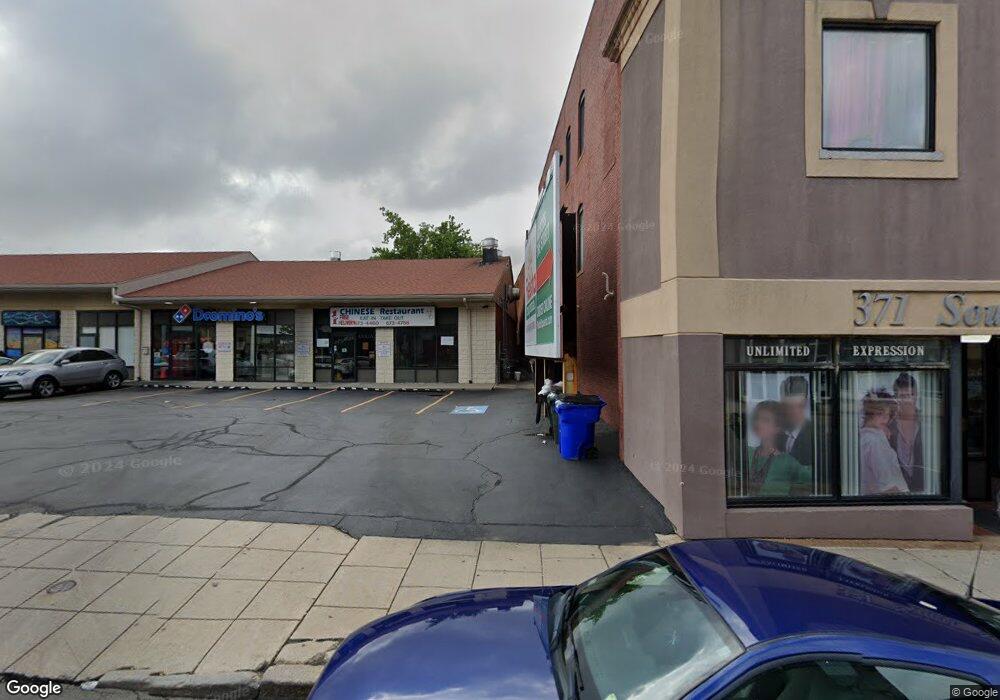
371 S Main St Fall River, MA 02721
Sandy Beach NeighborhoodEstimated Value: $662,734
Studio
--
Bath
10,144
Sq Ft
$65/Sq Ft
Est. Value
About This Home
This home is located at 371 S Main St, Fall River, MA 02721 and is currently priced at $662,734, approximately $65 per square foot. 371 S Main St is a home located in Bristol County with nearby schools including John J. Doran Community School, Matthew J. Kuss Middle School, and B M C Durfee High School.
Ownership History
Date
Name
Owned For
Owner Type
Purchase Details
Closed on
Jun 1, 2007
Sold by
Amaral Evelina F and Amaral Jose P
Bought by
Marjo Rt and Varao John A
Current Estimated Value
Purchase Details
Closed on
Apr 27, 1993
Sold by
Amaral Jose P and Camara Augustine
Bought by
Amaral Jose P and Amaral Evelina F
Home Financials for this Owner
Home Financials are based on the most recent Mortgage that was taken out on this home.
Original Mortgage
$152,000
Interest Rate
7.45%
Mortgage Type
Commercial
Create a Home Valuation Report for This Property
The Home Valuation Report is an in-depth analysis detailing your home's value as well as a comparison with similar homes in the area
Home Values in the Area
Average Home Value in this Area
Purchase History
| Date | Buyer | Sale Price | Title Company |
|---|---|---|---|
| Marjo Rt | $375,000 | -- | |
| Amaral Jose P | $62,500 | -- |
Source: Public Records
Mortgage History
| Date | Status | Borrower | Loan Amount |
|---|---|---|---|
| Previous Owner | Amaral Jose P | $219,000 | |
| Previous Owner | Amaral Jose P | $152,000 | |
| Previous Owner | Amaral Jose P | $193,000 | |
| Previous Owner | Amaral Jose P | $168,000 |
Source: Public Records
Tax History
| Year | Tax Paid | Tax Assessment Tax Assessment Total Assessment is a certain percentage of the fair market value that is determined by local assessors to be the total taxable value of land and additions on the property. | Land | Improvement |
|---|---|---|---|---|
| 2025 | $10,883 | $456,700 | $157,400 | $299,300 |
| 2024 | $10,756 | $449,300 | $150,000 | $299,300 |
| 2023 | $9,706 | $376,800 | $125,000 | $251,800 |
| 2022 | $10,185 | $376,800 | $125,000 | $251,800 |
| 2021 | $11,191 | $376,800 | $125,000 | $251,800 |
| 2020 | $11,258 | $367,800 | $115,600 | $252,200 |
| 2019 | $14,172 | $451,900 | $115,600 | $336,300 |
| 2018 | $14,063 | $451,900 | $115,600 | $336,300 |
| 2017 | $12,915 | $421,500 | $115,600 | $305,900 |
| 2016 | $12,278 | $421,500 | $115,600 | $305,900 |
| 2015 | $11,861 | $421,500 | $115,600 | $305,900 |
| 2014 | $11,246 | $421,500 | $115,600 | $305,900 |
Source: Public Records
Map
Nearby Homes
- 407 S Main St Unit A
- 407 S Main St Unit 1W
- 407 S Main St Unit 2
- 256 Union St Unit 3
- 256 Union St Unit 1
- 256 Union St Unit 2W
- 256 Union St
- 264 Union St Unit 1S
- 264 Union St Unit 2N
- 264 Union St Unit 1N
- 264 Union St Unit 2S
- 264 Union St
- 394 S Main St
- 258 Union St Unit 3E
- 258 Union St
- 376 S Main St
- 362 S Main St
- 335 S Main St
- 390 S Main St Unit 202
- 390 S Main St Unit suite2
Your Personal Tour Guide
Ask me questions while you tour the home.