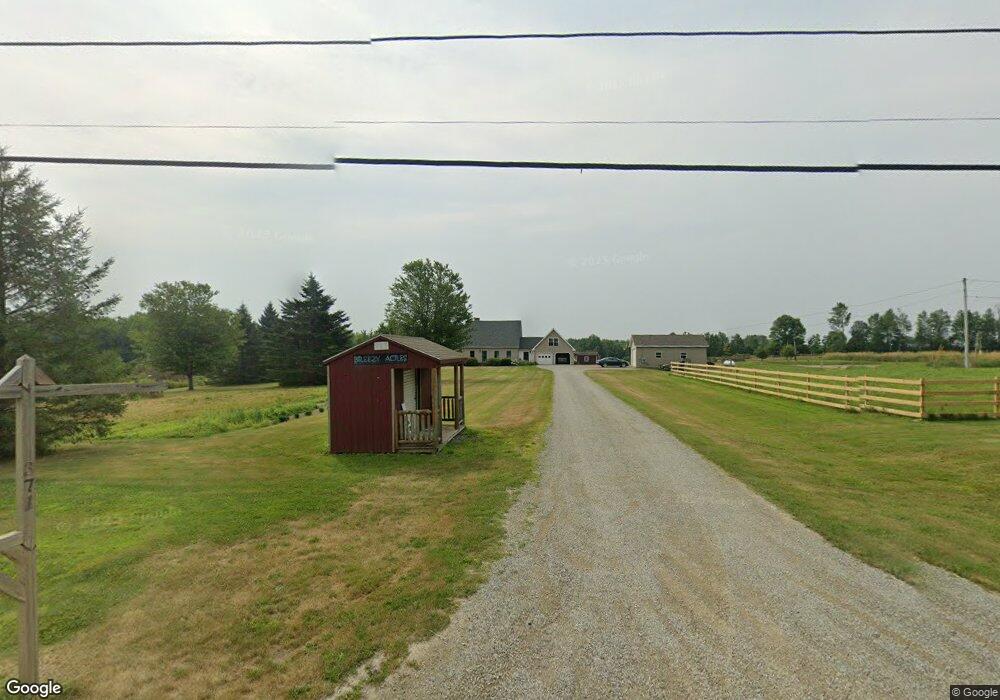
371 Stetson Rd Newport, ME 04953
Estimated Value: $327,000 - $667,000
5
Beds
2
Baths
2,681
Sq Ft
$193/Sq Ft
Est. Value
About This Home
This home is located at 371 Stetson Rd, Newport, ME 04953 and is currently estimated at $517,152, approximately $192 per square foot. 371 Stetson Rd is a home with nearby schools including Sebasticook Valley Elementary School and Nokomis Regional Middle School/High School.
Ownership History
Date
Name
Owned For
Owner Type
Purchase Details
Closed on
Jun 17, 2005
Sold by
Nevers David C
Bought by
King Emanuel Z and King Janet R
Current Estimated Value
Home Financials for this Owner
Home Financials are based on the most recent Mortgage that was taken out on this home.
Original Mortgage
$60,050
Outstanding Balance
$31,390
Interest Rate
5.78%
Mortgage Type
Purchase Money Mortgage
Estimated Equity
$485,762
Create a Home Valuation Report for This Property
The Home Valuation Report is an in-depth analysis detailing your home's value as well as a comparison with similar homes in the area
Home Values in the Area
Average Home Value in this Area
Purchase History
| Date | Buyer | Sale Price | Title Company |
|---|---|---|---|
| King Emanuel Z | -- | -- |
Source: Public Records
Mortgage History
| Date | Status | Borrower | Loan Amount |
|---|---|---|---|
| Open | King Emanuel Z | $60,050 |
Source: Public Records
Tax History Compared to Growth
Tax History
| Year | Tax Paid | Tax Assessment Tax Assessment Total Assessment is a certain percentage of the fair market value that is determined by local assessors to be the total taxable value of land and additions on the property. | Land | Improvement |
|---|---|---|---|---|
| 2024 | $7,098 | $405,600 | $42,600 | $363,000 |
| 2023 | $6,179 | $379,100 | $39,800 | $339,300 |
| 2022 | $5,872 | $299,600 | $31,500 | $268,100 |
| 2021 | $5,898 | $286,300 | $30,100 | $256,200 |
| 2020 | $5,789 | $281,000 | $29,500 | $251,500 |
| 2019 | $5,647 | $265,100 | $27,800 | $237,300 |
| 2018 | $5,089 | $238,900 | $27,800 | $211,100 |
| 2017 | $4,778 | $238,900 | $27,800 | $211,100 |
| 2016 | $4,635 | $238,900 | $27,800 | $211,100 |
| 2015 | $4,276 | $238,900 | $27,800 | $211,100 |
| 2014 | $4,114 | $239,200 | $27,800 | $211,400 |
Source: Public Records
Map
Nearby Homes