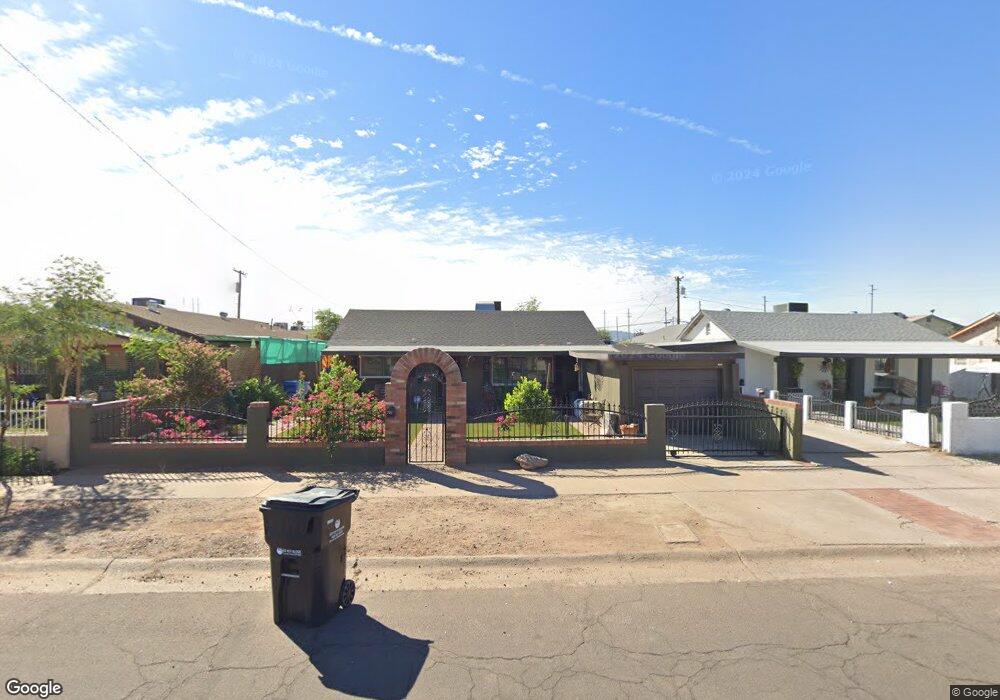
371 W Cocopah St Phoenix, AZ 85003
Central City NeighborhoodEstimated Value: $228,337 - $274,000
3
Beds
1
Bath
1,000
Sq Ft
$255/Sq Ft
Est. Value
About This Home
This home is located at 371 W Cocopah St, Phoenix, AZ 85003 and is currently estimated at $254,584, approximately $254 per square foot. 371 W Cocopah St is a home located in Maricopa County with nearby schools including Lowell School, Phoenix Coding Academy, and Central High School.
Ownership History
Date
Name
Owned For
Owner Type
Purchase Details
Closed on
Feb 7, 2022
Sold by
Amanda Linarez
Bought by
Linarez Ruben
Current Estimated Value
Purchase Details
Closed on
Mar 3, 2018
Sold by
Linarez Ruben
Bought by
Linarez Amanda
Purchase Details
Closed on
Sep 20, 2010
Sold by
Linarez Amanda
Bought by
Linarez Ruben and Linarez Amanda
Purchase Details
Closed on
Dec 11, 2007
Sold by
Baby Badu Unlimited Llc
Bought by
Linarez Amanda
Home Financials for this Owner
Home Financials are based on the most recent Mortgage that was taken out on this home.
Original Mortgage
$125,000
Interest Rate
6.2%
Mortgage Type
New Conventional
Purchase Details
Closed on
Sep 12, 2007
Sold by
Araiza Abe A and Araiza Joan
Bought by
Baby Badu Unlimited Llc
Home Financials for this Owner
Home Financials are based on the most recent Mortgage that was taken out on this home.
Original Mortgage
$37,800
Interest Rate
6.61%
Mortgage Type
New Conventional
Create a Home Valuation Report for This Property
The Home Valuation Report is an in-depth analysis detailing your home's value as well as a comparison with similar homes in the area
Home Values in the Area
Average Home Value in this Area
Purchase History
| Date | Buyer | Sale Price | Title Company |
|---|---|---|---|
| Linarez Ruben | -- | None Listed On Document | |
| Linarez Amanda | -- | None Available | |
| Linarez Ruben | -- | None Available | |
| Linarez Amanda | $125,000 | Capital Title Agency Inc | |
| Baby Badu Unlimited Llc | $42,000 | Capital Title Agency Inc |
Source: Public Records
Mortgage History
| Date | Status | Borrower | Loan Amount |
|---|---|---|---|
| Previous Owner | Linarez Amanda | $125,000 | |
| Previous Owner | Baby Badu Unlimited Llc | $37,800 |
Source: Public Records
Tax History Compared to Growth
Tax History
| Year | Tax Paid | Tax Assessment Tax Assessment Total Assessment is a certain percentage of the fair market value that is determined by local assessors to be the total taxable value of land and additions on the property. | Land | Improvement |
|---|---|---|---|---|
| 2025 | $852 | $7,188 | -- | -- |
| 2024 | $844 | $6,846 | -- | -- |
| 2023 | $844 | $16,960 | $3,390 | $13,570 |
| 2022 | $406 | $13,000 | $2,600 | $10,400 |
| 2021 | $406 | $10,380 | $2,070 | $8,310 |
| 2020 | $412 | $9,760 | $1,950 | $7,810 |
| 2019 | $412 | $7,450 | $1,490 | $5,960 |
| 2018 | $176 | $6,400 | $1,280 | $5,120 |
| 2017 | $170 | $4,660 | $930 | $3,730 |
| 2016 | $165 | $4,330 | $860 | $3,470 |
| 2015 | $150 | $3,450 | $690 | $2,760 |
Source: Public Records
Map
Nearby Homes
- 1707 S 7th Ave Unit 8
- 1622 S 7th Ave
- 1617 S 7th Ave Unit 9
- 1439 S 9th Ave Unit 4
- 340 W Yavapai St Unit 9
- 1120 S 4th Ave
- 1102 S 4th Ave
- 1018 S 4th Ave
- 1217 S 9th Ave Unit 1 & 2
- 1006 S 3rd Ave
- 1700 S 1st St Unit 1
- 1755 S Central Ave Unit 15
- 819 S 3rd Ave
- 1117 W Buckeye Rd Unit 5
- 1229 S 13th Ave
- 1218 S 13th Ave Unit 47
- 1214 S 13th Ave Unit 49
- 1014 S 2nd St
- 742 S 1st St
- 116 E Hadley St
- 375 W Cocopah St
- 369 W Cocopah St
- 379 W Cocopah St
- 363 W Cocopah St
- 383 W Cocopah St
- 359 W Cocopah St
- 354 W Mohave St
- 358 W Mohave St
- 355 W Cocopah St
- 372 W Cocopah St
- 368 W Cocopah St
- 376 W Cocopah St
- 387 W Cocopah St
- 366 W Mohave St
- 364 W Cocopah St
- 382 W Cocopah St
- 370 W Mohave St Unit 2
- 370 W Mohave St Unit 3
- 370 W Mohave St