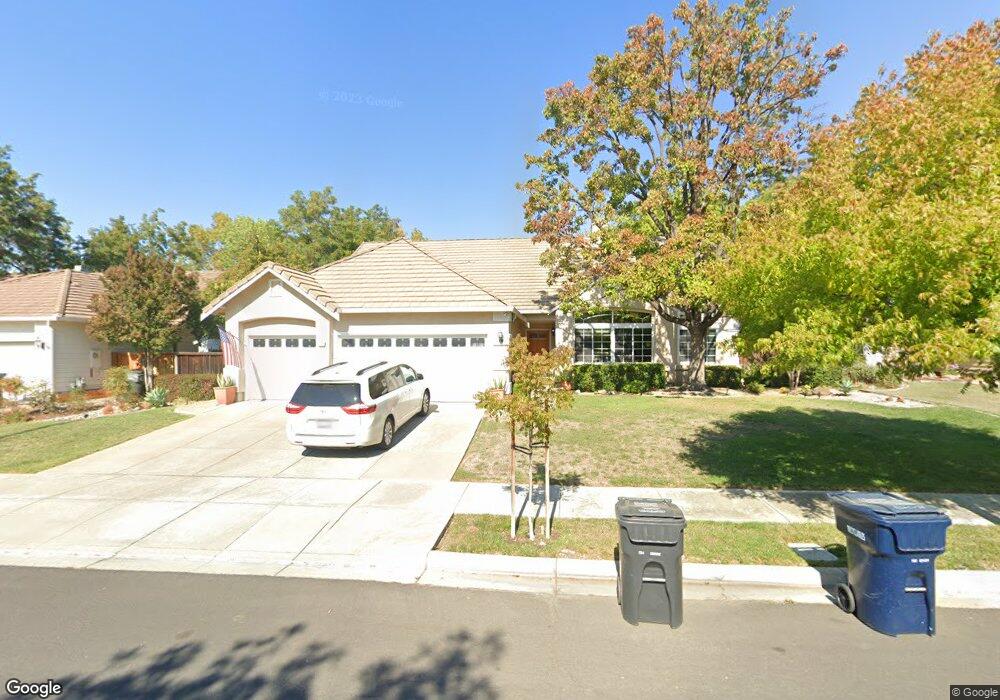
3710 Valley View Way Livermore, CA 94551
Portola Glen NeighborhoodEstimated Value: $1,447,534 - $1,736,000
4
Beds
2
Baths
2,342
Sq Ft
$679/Sq Ft
Est. Value
About This Home
This home is located at 3710 Valley View Way, Livermore, CA 94551 and is currently estimated at $1,589,384, approximately $678 per square foot. 3710 Valley View Way is a home located in Alameda County with nearby schools including Junction Avenue K-8 School, Livermore High School, and Valley Montessori School.
Ownership History
Date
Name
Owned For
Owner Type
Purchase Details
Closed on
Dec 13, 2012
Sold by
Balquist John and The Josephine E Hutchins 1982
Bought by
Leonetti Joseph Albert and Leonetti Arnette A R
Current Estimated Value
Home Financials for this Owner
Home Financials are based on the most recent Mortgage that was taken out on this home.
Original Mortgage
$518,400
Outstanding Balance
$358,828
Interest Rate
3.35%
Mortgage Type
New Conventional
Estimated Equity
$1,230,556
Purchase Details
Closed on
Aug 29, 1997
Sold by
Hutchins Adrienne L
Bought by
Hutchins John P
Purchase Details
Closed on
Nov 22, 1993
Sold by
Pulte Home Corp
Bought by
Revo Hutchins Josephine E and Revo Josephine E Hutchins 1982
Home Financials for this Owner
Home Financials are based on the most recent Mortgage that was taken out on this home.
Original Mortgage
$70,000
Interest Rate
6.88%
Create a Home Valuation Report for This Property
The Home Valuation Report is an in-depth analysis detailing your home's value as well as a comparison with similar homes in the area
Home Values in the Area
Average Home Value in this Area
Purchase History
| Date | Buyer | Sale Price | Title Company |
|---|---|---|---|
| Leonetti Joseph Albert | $669,000 | Old Republic Title Company | |
| Hutchins John P | -- | Old Republic Title Company | |
| Revo Hutchins Josephine E | $330,000 | First American Title |
Source: Public Records
Mortgage History
| Date | Status | Borrower | Loan Amount |
|---|---|---|---|
| Open | Leonetti Joseph Albert | $518,400 | |
| Previous Owner | Revo Hutchins Josephine E | $70,000 |
Source: Public Records
Tax History Compared to Growth
Tax History
| Year | Tax Paid | Tax Assessment Tax Assessment Total Assessment is a certain percentage of the fair market value that is determined by local assessors to be the total taxable value of land and additions on the property. | Land | Improvement |
|---|---|---|---|---|
| 2025 | $11,023 | $838,765 | $247,137 | $598,628 |
| 2024 | $11,023 | $822,185 | $242,293 | $586,892 |
| 2023 | $10,855 | $812,927 | $237,542 | $575,385 |
| 2022 | $10,681 | $789,993 | $232,886 | $564,107 |
| 2021 | $10,227 | $754,067 | $228,320 | $532,747 |
| 2020 | $9,884 | $753,267 | $225,980 | $527,287 |
| 2019 | $9,961 | $738,501 | $221,550 | $516,951 |
| 2018 | $9,745 | $724,024 | $217,207 | $506,817 |
| 2017 | $9,492 | $709,828 | $212,948 | $496,880 |
| 2016 | $9,105 | $695,913 | $208,774 | $487,139 |
| 2015 | $8,552 | $685,463 | $205,639 | $479,824 |
| 2014 | $8,410 | $672,037 | $201,611 | $470,426 |
Source: Public Records
Map
Nearby Homes
- 3473 Edinburgh Dr
- 385 Kensington Common
- 304 Avondale Ln
- 3287 Edinburgh Dr
- 3971 Portola Common Unit 1
- 635 Eliot Dr
- 236 Plum Tree St
- 513 Briarwood Ct
- 3370 Gardella Plaza
- 2845 Briarwood Dr
- 202 Sonia Way
- 3959 Purdue Way
- 3877 Santa Clara Way
- 3965 Purdue Way
- 3902 Dartmouth Way
- 3491 Madeira Way
- 2908 Worthing Common
- 4715 Marengo Common
- 4711 Marengo Common
- Residence 3 Plan at Amara at Arroyo Crossings
- 3716 Valley View Way
- 3704 Valley View Way
- 3728 Valley View Way
- 3605 Valley View Ct
- 3713 Valley View Way
- 3725 Valley View Way
- 3633 Montrose Place
- 3732 Valley View Way
- 3627 Montrose Place
- 3641 Montrose Place
- 701 Forester Ct
- 3602 Valley View Ct
- 3619 Montrose Place
- 3643 Valley View Ct
- 3657 Montrose Place
- 3744 Valley View Way
- 643 Amberwood Way
- 723 Forester Ct
- 3626 Valley View Ct
- 3688 Valley View Ct