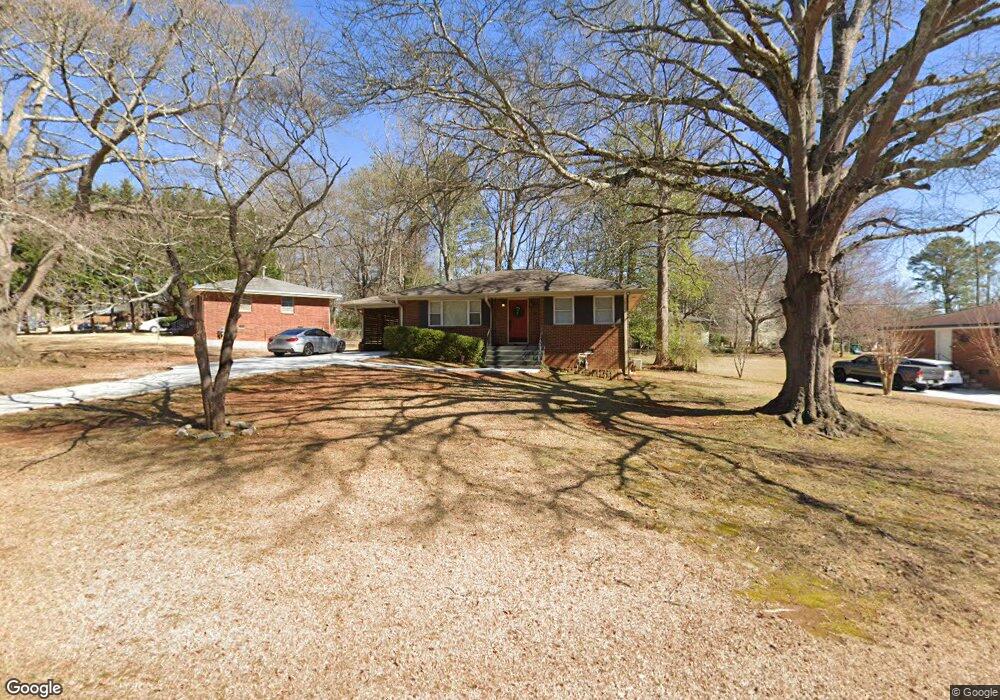
3711 Wisteria Ln SE Smyrna, GA 30082
Estimated Value: $310,000 - $349,000
3
Beds
1
Bath
1,068
Sq Ft
$315/Sq Ft
Est. Value
About This Home
This home is located at 3711 Wisteria Ln SE, Smyrna, GA 30082 and is currently estimated at $336,869, approximately $315 per square foot. 3711 Wisteria Ln SE is a home located in Cobb County with nearby schools including King Springs Elementary School, Griffin Middle School, and Campbell High School.
Ownership History
Date
Name
Owned For
Owner Type
Purchase Details
Closed on
Sep 26, 2008
Sold by
Chesley Sherri
Bought by
Rasmussen Amy E
Current Estimated Value
Home Financials for this Owner
Home Financials are based on the most recent Mortgage that was taken out on this home.
Original Mortgage
$144,400
Outstanding Balance
$95,724
Interest Rate
6.45%
Mortgage Type
New Conventional
Estimated Equity
$241,145
Purchase Details
Closed on
Apr 20, 2000
Sold by
Morrell Brad S
Bought by
Chesley Sherri
Home Financials for this Owner
Home Financials are based on the most recent Mortgage that was taken out on this home.
Original Mortgage
$112,368
Interest Rate
8.24%
Mortgage Type
FHA
Purchase Details
Closed on
May 21, 1998
Sold by
Conkle Irene
Bought by
Morrell Brad S
Create a Home Valuation Report for This Property
The Home Valuation Report is an in-depth analysis detailing your home's value as well as a comparison with similar homes in the area
Home Values in the Area
Average Home Value in this Area
Purchase History
| Date | Buyer | Sale Price | Title Company |
|---|---|---|---|
| Rasmussen Amy E | $152,000 | -- | |
| Chesley Sherri | $113,300 | -- | |
| Morrell Brad S | $65,000 | -- |
Source: Public Records
Mortgage History
| Date | Status | Borrower | Loan Amount |
|---|---|---|---|
| Open | Rasmussen Amy E | $144,400 | |
| Previous Owner | Chesley Sherri | $112,368 | |
| Closed | Morrell Brad S | -- |
Source: Public Records
Tax History Compared to Growth
Tax History
| Year | Tax Paid | Tax Assessment Tax Assessment Total Assessment is a certain percentage of the fair market value that is determined by local assessors to be the total taxable value of land and additions on the property. | Land | Improvement |
|---|---|---|---|---|
| 2025 | $2,616 | $128,616 | $52,000 | $76,616 |
| 2024 | $2,857 | $141,528 | $52,000 | $89,528 |
| 2023 | $2,019 | $122,852 | $40,000 | $82,852 |
| 2022 | $2,213 | $106,060 | $34,000 | $72,060 |
| 2021 | $1,956 | $91,828 | $26,000 | $65,828 |
| 2020 | $1,898 | $88,804 | $26,000 | $62,804 |
| 2019 | $1,831 | $85,236 | $24,000 | $61,236 |
| 2018 | $1,630 | $74,700 | $24,000 | $50,700 |
| 2017 | $1,237 | $58,248 | $24,000 | $34,248 |
| 2016 | $1,108 | $52,888 | $24,000 | $28,888 |
| 2015 | $691 | $36,020 | $23,940 | $12,080 |
| 2014 | $698 | $36,020 | $0 | $0 |
Source: Public Records
Map
Nearby Homes
- 3654 Lake Dr SE
- 1024 Magnolia Dr SE
- 3568 Lake Dr SE
- 116 Festoon Ct
- 3543 S Cobb Dr SE
- 303 Mill Pond Ct SE
- 3844 Lake Dr SE
- 1522 Grace Meadows Ln SE
- 4222 Terrace Ct SE
- 1019 Magbee Dr SE
- 606 Mill Pond Dr SE
- 609 Mill Pond Dr SE
- 610 Mill Pond Dr SE
- 982 Oakdale Dr SE
- 305 Berkeley Ct SE
- 1042 Oakdale Dr SE
- 505 Bridge Ln SE
- 502 Bridge Ln SE
- 3941 Lake Dr SE
- 3695 Wisteria Ln SE
- 941 Brentwood Dr SE
- 3689 Wisteria Ln SE
- 3700 Wisteria Ln SE
- 3710 Wisteria Ln SE
- 3720 Wisteria Ln SE
- 3696 Wisteria Ln SE
- 3730 Wisteria Ln SE
- 951 Brentwood Dr SE
- 3690 Wisteria Ln SE
- 0 Brentwood Dr Unit 7508095
- 0 Brentwood Dr Unit 7096440
- 0 Brentwood Dr Unit 8177169
- 0 Brentwood Dr Unit 8143405
- 0 Brentwood Dr
- 930 Brentwood Dr SE
- 940 Brentwood Dr SE
- 922 Brentwood Dr SE
- 3684 Wisteria Ln SE
- 959 Brentwood Dr SE