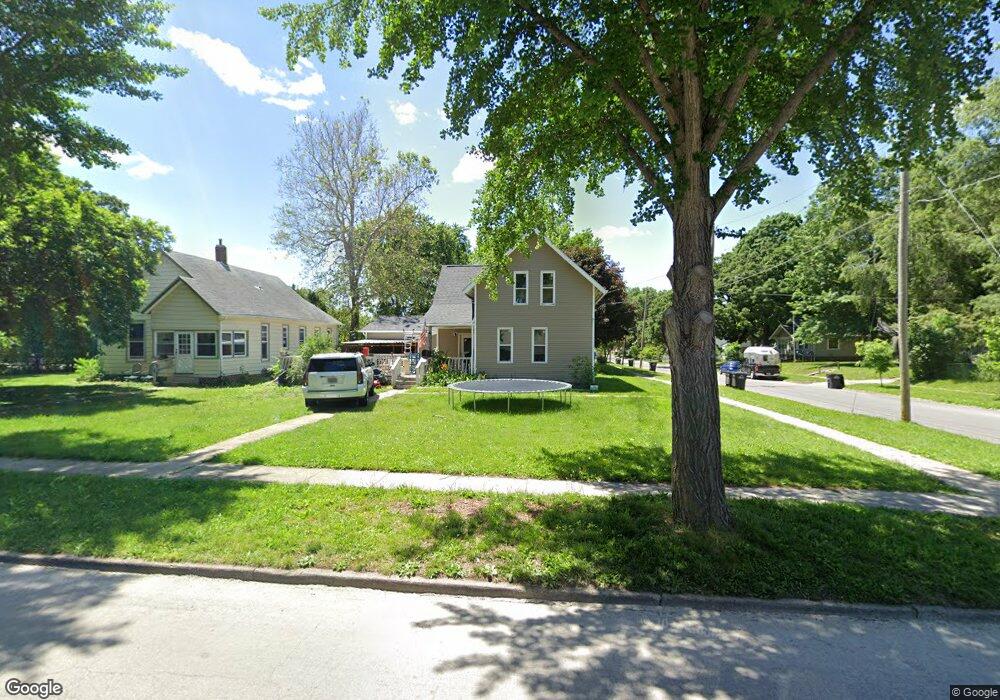
3712 8th St Des Moines, IA 50313
Oak Park NeighborhoodEstimated Value: $154,000 - $170,000
2
Beds
1
Bath
1,146
Sq Ft
$141/Sq Ft
Est. Value
About This Home
This home is located at 3712 8th St, Des Moines, IA 50313 and is currently estimated at $161,397, approximately $140 per square foot. 3712 8th St is a home located in Polk County with nearby schools including Oak Park Elementary School, Harding Middle School, and North High School.
Ownership History
Date
Name
Owned For
Owner Type
Purchase Details
Closed on
Nov 6, 2017
Sold by
Augspurger Scott
Bought by
Routh Aaron M
Current Estimated Value
Home Financials for this Owner
Home Financials are based on the most recent Mortgage that was taken out on this home.
Original Mortgage
$82,000
Interest Rate
8%
Purchase Details
Closed on
Apr 30, 2000
Sold by
Augspurger Scott A and Augspurger Diana M
Bought by
Dyer Troy D and Dyer Cindy B
Home Financials for this Owner
Home Financials are based on the most recent Mortgage that was taken out on this home.
Original Mortgage
$55,000
Interest Rate
8.19%
Mortgage Type
Seller Take Back
Create a Home Valuation Report for This Property
The Home Valuation Report is an in-depth analysis detailing your home's value as well as a comparison with similar homes in the area
Home Values in the Area
Average Home Value in this Area
Purchase History
| Date | Buyer | Sale Price | Title Company |
|---|---|---|---|
| Routh Aaron M | $89,000 | None Available | |
| Dyer Troy D | $55,000 | -- |
Source: Public Records
Mortgage History
| Date | Status | Borrower | Loan Amount |
|---|---|---|---|
| Previous Owner | Routh Aaron M | $82,000 | |
| Previous Owner | Dyer Troy D | $55,000 |
Source: Public Records
Tax History Compared to Growth
Tax History
| Year | Tax Paid | Tax Assessment Tax Assessment Total Assessment is a certain percentage of the fair market value that is determined by local assessors to be the total taxable value of land and additions on the property. | Land | Improvement |
|---|---|---|---|---|
| 2025 | $2,492 | $145,300 | $31,300 | $114,000 |
| 2024 | $2,492 | $126,700 | $27,100 | $99,600 |
| 2023 | $2,402 | $126,700 | $27,100 | $99,600 |
| 2022 | $2,384 | $101,900 | $22,900 | $79,000 |
| 2021 | $2,266 | $101,900 | $22,900 | $79,000 |
| 2020 | $2,354 | $90,800 | $20,500 | $70,300 |
| 2019 | $2,370 | $90,800 | $20,500 | $70,300 |
| 2018 | $2,346 | $88,200 | $18,600 | $69,600 |
| 2017 | $2,174 | $88,200 | $18,600 | $69,600 |
| 2016 | $2,471 | $80,400 | $16,700 | $63,700 |
| 2015 | $2,118 | $80,400 | $16,700 | $63,700 |
| 2014 | $1,990 | $77,700 | $16,100 | $61,600 |
Source: Public Records
Map
Nearby Homes
- 3710 8th St
- 808 Douglas Ave
- 803 Douglas Ave
- 720 Douglas Ave
- 816 Douglas Ave
- 3806 8th St
- 3702 8th St
- 714 Douglas Ave
- 803 Clinton Ave
- 817 Douglas Ave
- 805 Clinton Ave
- 820 Douglas Ave
- 821 Douglas Ave
- 3808 8th St
- 817 Clinton Ave
- 723 Douglas Ave
- 710 Douglas Ave
- 715 Clinton Ave
- 819 Clinton Ave
- 719 Douglas Ave