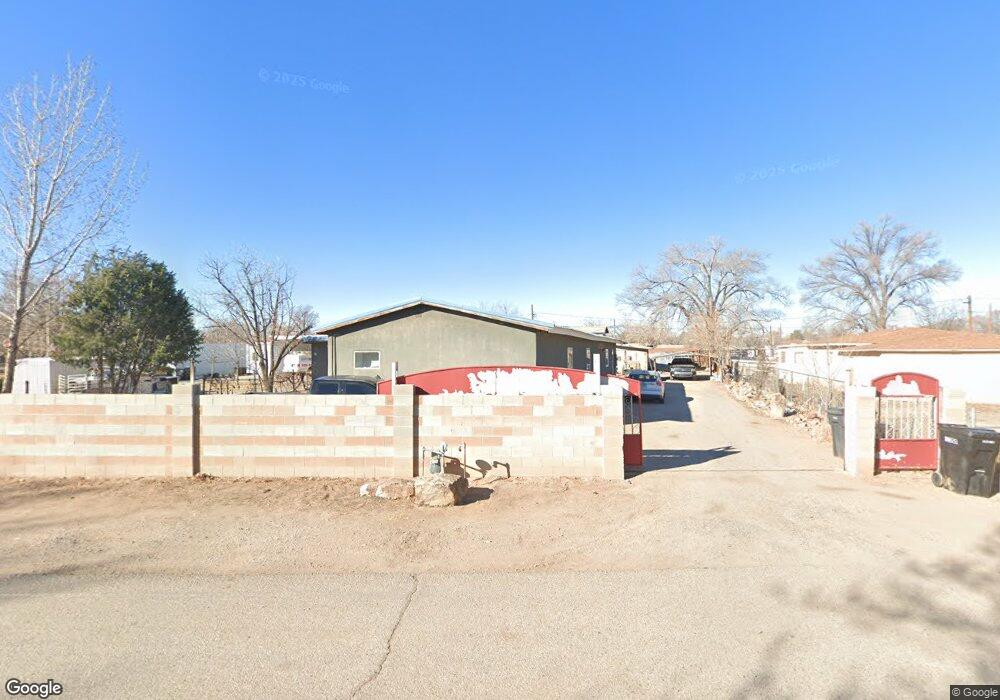
3713 Entrada Bonita St SW Albuquerque, NM 87105
Estimated Value: $274,000 - $416,000
3
Beds
2
Baths
1,929
Sq Ft
$170/Sq Ft
Est. Value
About This Home
This home is located at 3713 Entrada Bonita St SW, Albuquerque, NM 87105 and is currently estimated at $328,563, approximately $170 per square foot. 3713 Entrada Bonita St SW is a home located in Bernalillo County with nearby schools including Adobe Acres Elementary School, Harrison Middle School, and Rio Grande High School.
Ownership History
Date
Name
Owned For
Owner Type
Purchase Details
Closed on
Jun 12, 2009
Sold by
Cano Monica
Bought by
Cano Alejandro
Current Estimated Value
Purchase Details
Closed on
Aug 29, 2002
Sold by
Trusty Delphia and Trusty Murphree O
Bought by
Cano Alejandro and Cano Monica
Home Financials for this Owner
Home Financials are based on the most recent Mortgage that was taken out on this home.
Original Mortgage
$35,000
Interest Rate
7%
Mortgage Type
Seller Take Back
Purchase Details
Closed on
Aug 21, 1998
Sold by
Trusty Delphia Or and Murphree Delphia Lee
Bought by
Montoya Bonifacio R and Pena Dora A
Home Financials for this Owner
Home Financials are based on the most recent Mortgage that was taken out on this home.
Original Mortgage
$48,000
Interest Rate
8%
Create a Home Valuation Report for This Property
The Home Valuation Report is an in-depth analysis detailing your home's value as well as a comparison with similar homes in the area
Home Values in the Area
Average Home Value in this Area
Purchase History
| Date | Buyer | Sale Price | Title Company |
|---|---|---|---|
| Cano Alejandro | -- | None Available | |
| Cano Alejandro | -- | None Available | |
| Cano Alejandro | $40,000 | None Available | |
| Montoya Bonifacio R | $48,000 | Fidelity National Title Ins |
Source: Public Records
Mortgage History
| Date | Status | Borrower | Loan Amount |
|---|---|---|---|
| Previous Owner | Cano Alejandro | $35,000 | |
| Previous Owner | Montoya Bonifacio R | $48,000 |
Source: Public Records
Tax History Compared to Growth
Tax History
| Year | Tax Paid | Tax Assessment Tax Assessment Total Assessment is a certain percentage of the fair market value that is determined by local assessors to be the total taxable value of land and additions on the property. | Land | Improvement |
|---|---|---|---|---|
| 2025 | $1,531 | $44,549 | $13,523 | $31,026 |
| 2024 | $1,531 | $43,252 | $13,129 | $30,123 |
| 2023 | $1,501 | $41,992 | $12,747 | $29,245 |
| 2022 | $1,411 | $40,770 | $12,376 | $28,394 |
| 2021 | $1,362 | $39,582 | $12,015 | $27,567 |
| 2020 | $1,336 | $38,430 | $11,666 | $26,764 |
| 2019 | $1,333 | $38,346 | $12,015 | $26,331 |
| 2018 | $1,284 | $38,346 | $12,015 | $26,331 |
| 2017 | $1,277 | $37,230 | $11,666 | $25,564 |
| 2016 | $1,266 | $37,330 | $11,666 | $25,664 |
| 2015 | $36,456 | $36,456 | $9,218 | $27,238 |
| 2014 | $1,174 | $35,394 | $8,950 | $26,444 |
| 2013 | -- | $34,363 | $8,689 | $25,674 |
Source: Public Records
Map
Nearby Homes
- 3742 Isleta Blvd SW
- 1431 Tierra Verde Place SW
- 3820 Beall Ct SW
- 4001 Donald Rd SW
- 1905 Lakeview Rd SW
- 1743 Antone Loop Rd SW
- 3641 Cameo Dr SE
- 308 Gore Ave SE
- 5016 5th St SW
- 4307 Wallace St SE
- 425 Shirk Ln SW
- 2621 Del Sur Dr SW
- 4303 Kennard Ave SE
- 4625 Sunny Cir SW
- 312 Shirk Ln SW
- 301 Shirk Ln SW
- 1723 Valley Rd SW
- 4312 March St SE
- 2617 Verde Rd SW
- 2830 Rio Bravo Blvd SW
- 3717 Entrada Bonita St SW
- 1220 Entrada Bonita St SW
- 3721 Entrada Bonita St SW
- 3721 Entrada Bonita St SW
- 1225 Entrada Bonita St SW
- 1221 Entrada Bonita St SW
- 3413 El Porvenir Cir SW
- 1227 Entrada Bonita St SW
- 3411 El Porvenir Cir SW
- 3414 El Porvenir Cir SW
- 3409 El Porvenir Cir SW
- 1213 Entrada Bonita St SW
- 1215 Entrada Bonita St SW
- 1201 Entrada Bonita St SW
- 1231 Entrada Bonita St SW
- 1317 Entrada Bonita St SW
- 1217 Entrada Bonita St SW
- 1321 Entrada Bonita St SW
- 1237 Entrada Bonita St SW
- 1401 Santa Rosa Rd SW