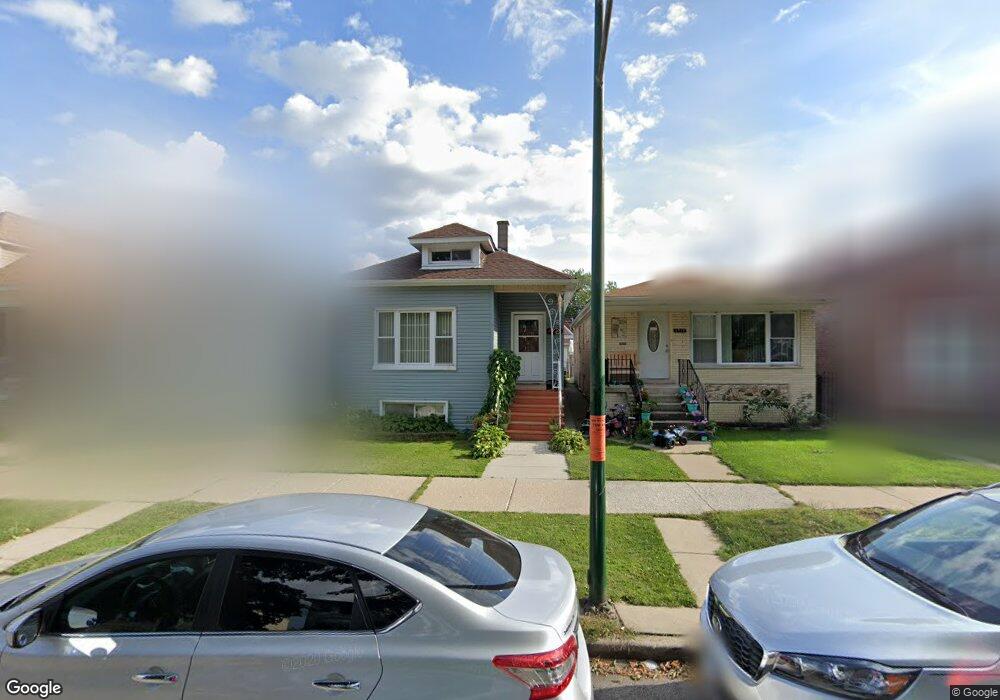
3713 W 61st St Chicago, IL 60629
West Lawn NeighborhoodEstimated Value: $233,000 - $325,000
2
Beds
1
Bath
894
Sq Ft
$298/Sq Ft
Est. Value
About This Home
This home is located at 3713 W 61st St, Chicago, IL 60629 and is currently estimated at $266,371, approximately $297 per square foot. 3713 W 61st St is a home located in Cook County with nearby schools including Peck Elementary School, Richardson Middle School, and Hubbard High School.
Ownership History
Date
Name
Owned For
Owner Type
Purchase Details
Closed on
Feb 17, 2009
Sold by
Lasalle Bank National Association
Bought by
Navarro Francisco
Current Estimated Value
Purchase Details
Closed on
Jan 9, 2008
Sold by
Razo Abel
Bought by
Lasalle Bank Na and Bear Stearns Asset Backed Securities I L
Purchase Details
Closed on
Mar 10, 2004
Sold by
Morelos Jose
Bought by
Razo Abel
Home Financials for this Owner
Home Financials are based on the most recent Mortgage that was taken out on this home.
Original Mortgage
$143,800
Interest Rate
5.74%
Mortgage Type
Unknown
Purchase Details
Closed on
May 29, 2003
Sold by
Wiencek Alice and Kristensen Troy
Bought by
Morelos Jose A
Home Financials for this Owner
Home Financials are based on the most recent Mortgage that was taken out on this home.
Original Mortgage
$103,500
Interest Rate
5.3%
Mortgage Type
Unknown
Create a Home Valuation Report for This Property
The Home Valuation Report is an in-depth analysis detailing your home's value as well as a comparison with similar homes in the area
Home Values in the Area
Average Home Value in this Area
Purchase History
| Date | Buyer | Sale Price | Title Company |
|---|---|---|---|
| Navarro Francisco | $50,000 | First American Title | |
| Lasalle Bank Na | -- | None Available | |
| Razo Abel | $151,500 | Pntn | |
| Morelos Jose A | $115,000 | Atgf Inc |
Source: Public Records
Mortgage History
| Date | Status | Borrower | Loan Amount |
|---|---|---|---|
| Previous Owner | Razo Abel | $143,800 | |
| Previous Owner | Morelos Jose A | $103,500 |
Source: Public Records
Tax History Compared to Growth
Tax History
| Year | Tax Paid | Tax Assessment Tax Assessment Total Assessment is a certain percentage of the fair market value that is determined by local assessors to be the total taxable value of land and additions on the property. | Land | Improvement |
|---|---|---|---|---|
| 2024 | $1,842 | $17,000 | $2,500 | $14,500 |
| 2023 | $1,775 | $12,000 | $3,125 | $8,875 |
| 2022 | $1,775 | $12,000 | $3,125 | $8,875 |
| 2021 | $1,743 | $12,000 | $3,125 | $8,875 |
| 2020 | $2,343 | $13,550 | $3,125 | $10,425 |
| 2019 | $2,385 | $15,225 | $3,125 | $12,100 |
| 2018 | $2,344 | $15,225 | $3,125 | $12,100 |
| 2017 | $2,160 | $13,344 | $2,812 | $10,532 |
| 2016 | $2,187 | $13,344 | $2,812 | $10,532 |
| 2015 | $1,979 | $13,344 | $2,812 | $10,532 |
| 2014 | $1,936 | $12,923 | $2,656 | $10,267 |
| 2013 | $1,887 | $12,923 | $2,656 | $10,267 |
Source: Public Records
Map
Nearby Homes
- 3710 W 60th Place
- 3817 W 61st St
- 3817 W 61st Place
- 3709 W 59th Place
- 3745 W 59th Place
- 3700 W 63rd St
- 3909 W 60th Place
- 3501 W 61st Place
- 3751 W 63rd Place
- 2711 W 59th St
- 3914 W 63rd St Unit 3B
- 3617 W 63rd Place
- 3912 W 59th St
- 3529 W 63rd Place
- 3441 W 59th St
- 3904 W 58th Place
- 6235 S Komensky Ave
- 3651 W 64th Place
- 3502 W 58th Place
- 3349 W 60th Place
- 3711 W 61st St
- 3717 W 61st St
- 3719 W 61st St
- 3709 W 61st St
- 3721 W 61st St
- 3705 W 61st St
- 3723 W 61st St
- 3701 W 61st St
- 3727 W 61st St
- 3714 W 61st Place
- 3716 W 61st Place
- 3729 W 61st St
- 3706 W 61st Place
- 3704 W 61st Place
- 3708 W 61st Place
- 3722 W 61st Place
- 3720 W 61st Place
- 3710 W 61st St
- 3731 W 61st St
- 3700 W 61st Place