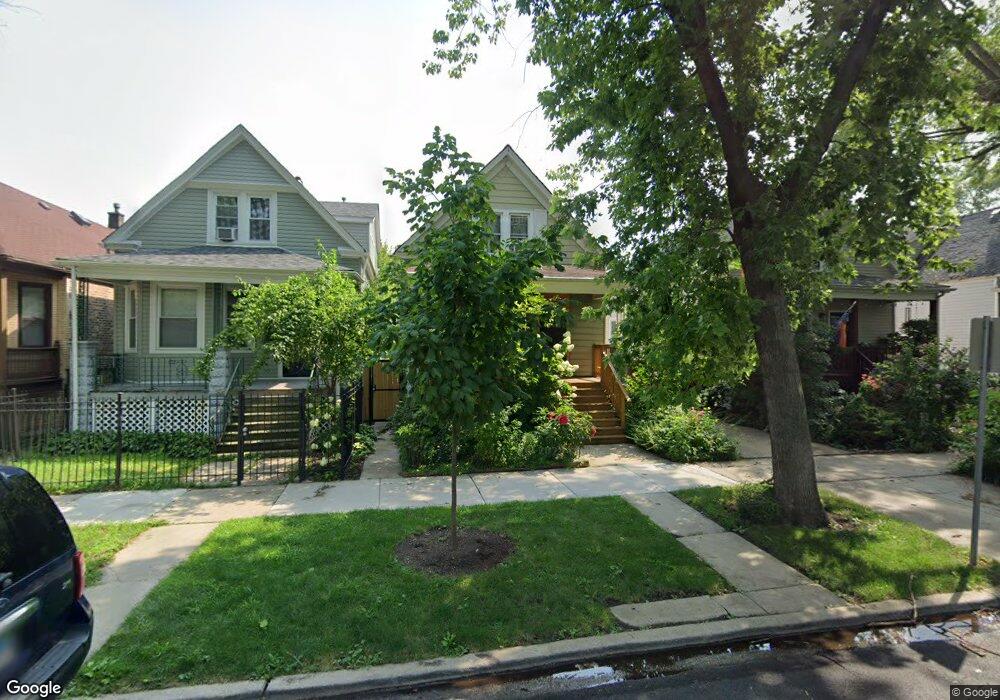
3713 W Sunnyside Ave Chicago, IL 60625
Albany Park NeighborhoodEstimated Value: $364,000 - $411,972
3
Beds
1
Bath
942
Sq Ft
$418/Sq Ft
Est. Value
About This Home
This home is located at 3713 W Sunnyside Ave, Chicago, IL 60625 and is currently estimated at $393,657, approximately $417 per square foot. 3713 W Sunnyside Ave is a home located in Cook County with nearby schools including Haugan Elementary School, Roosevelt High School, and ASPIRA Haugan Middle School.
Ownership History
Date
Name
Owned For
Owner Type
Purchase Details
Closed on
May 28, 2010
Sold by
Chavez Jesus and Chavez Maria A
Bought by
Chavez Maria A
Current Estimated Value
Purchase Details
Closed on
Jul 12, 2001
Sold by
Karbin Craig J and Kabrin Craig J
Bought by
Chavez Jesus J and Chavez Maria A
Home Financials for this Owner
Home Financials are based on the most recent Mortgage that was taken out on this home.
Original Mortgage
$81,000
Interest Rate
7.22%
Purchase Details
Closed on
Nov 5, 1997
Sold by
Young Nancy L
Bought by
Kabrin Craig J
Purchase Details
Closed on
Dec 9, 1993
Sold by
Strey Leslie
Bought by
Kabrin Craig J
Home Financials for this Owner
Home Financials are based on the most recent Mortgage that was taken out on this home.
Original Mortgage
$109,140
Interest Rate
7.15%
Mortgage Type
Assumption
Create a Home Valuation Report for This Property
The Home Valuation Report is an in-depth analysis detailing your home's value as well as a comparison with similar homes in the area
Home Values in the Area
Average Home Value in this Area
Purchase History
| Date | Buyer | Sale Price | Title Company |
|---|---|---|---|
| Chavez Maria A | -- | None Available | |
| Chavez Jesus J | $135,000 | Chicago Title Insurance Co | |
| Kabrin Craig J | -- | -- | |
| Kabrin Craig J | $71,333 | -- |
Source: Public Records
Mortgage History
| Date | Status | Borrower | Loan Amount |
|---|---|---|---|
| Closed | Chavez Jesus J | $81,000 | |
| Previous Owner | Kabrin Craig J | $109,140 |
Source: Public Records
Tax History Compared to Growth
Tax History
| Year | Tax Paid | Tax Assessment Tax Assessment Total Assessment is a certain percentage of the fair market value that is determined by local assessors to be the total taxable value of land and additions on the property. | Land | Improvement |
|---|---|---|---|---|
| 2024 | $4,829 | $35,250 | $10,938 | $24,312 |
| 2023 | $5,108 | $26,968 | $8,750 | $18,218 |
| 2022 | $5,108 | $29,013 | $8,750 | $20,263 |
| 2021 | $5,010 | $28,165 | $8,750 | $19,415 |
| 2020 | $3,996 | $20,976 | $4,531 | $16,445 |
| 2019 | $4,060 | $23,569 | $4,531 | $19,038 |
| 2018 | $3,830 | $22,762 | $4,531 | $18,231 |
| 2017 | $3,743 | $20,707 | $4,062 | $16,645 |
| 2016 | $3,659 | $20,707 | $4,062 | $16,645 |
| 2015 | $3,325 | $20,707 | $4,062 | $16,645 |
| 2014 | $2,718 | $17,164 | $3,750 | $13,414 |
| 2013 | $2,653 | $17,164 | $3,750 | $13,414 |
Source: Public Records
Map
Nearby Homes
- 3733 W Sunnyside Ave
- 4515 N Hamlin Ave
- 3816 W Montrose Ave
- 4619 N Lawndale Ave Unit 1
- 3550 W Montrose Ave Unit 107
- 4426 N Drake Ave
- 4304 N Lawndale Ave
- 4621 N Monticello Ave
- 3707 W Cullom Ave Unit 1
- 4602 N Springfield Ave
- 4534 N Saint Louis Ave
- 4614 N Springfield Ave
- 4416 N Harding Ave Unit 3
- 4624 N Springfield Ave
- 4249 N Central Park Ave
- 3711 W Lawrence Ave
- 4734 N Drake Ave
- 4207 N Drake Ave
- 4203 N Drake Ave
- 4387 N Elston Ave
- 3711 W Sunnyside Ave
- 3717 W Sunnyside Ave
- 3707 W Sunnyside Ave
- 3705 W Sunnyside Ave
- 3725 W Sunnyside Ave
- 3747 W Sunnyside Ave
- 3747 W Sunnyside Ave Unit 3
- 3714 W Agatite Ave
- 3714 W Agatite Ave Unit 3
- 3714 W Agatite Ave
- 3718 W Agatite Ave
- 3708 W Agatite Ave Unit 2
- 3708 W Agatite Ave
- 3706 W Agatite Ave
- 3729 W Sunnyside Ave Unit 1
- 3729 W Sunnyside Ave Unit 3
- 3729 W Sunnyside Ave Unit 2
- 3710 W Agatite Ave
- 3710 W Agatite Ave Unit 1
- 3710 W Agatite Ave Unit 2