Estimated Value: $832,000 - $916,000
--
Bed
4
Baths
2,524
Sq Ft
$345/Sq Ft
Est. Value
About This Home
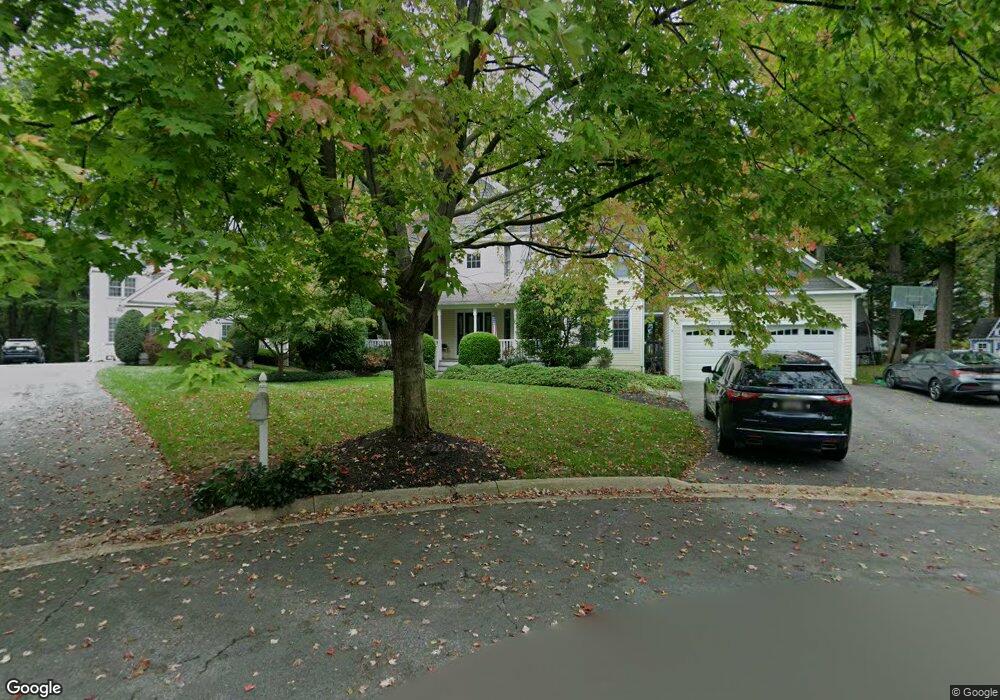
This home is located at 3715 Monitor Place, Olney, MD 20832 and is currently estimated at $870,316, approximately $344 per square foot. 3715 Monitor Place is a home located in Montgomery County with nearby schools including Olney Elementary School, Rosa M. Parks Middle School, and Lawrence Junior/Senior High School.
Ownership History
Date
Name
Owned For
Owner Type
Purchase Details
Closed on
Sep 30, 2004
Sold by
Orebaugh Howard D and Orebaugh M T
Bought by
Blumstein Eyal and Blumstein Laurie Weis
Current Estimated Value
Purchase Details
Closed on
Aug 17, 1995
Sold by
Classic Community Building Corp
Bought by
Orebaugh Howard D
Home Financials for this Owner
Home Financials are based on the most recent Mortgage that was taken out on this home.
Original Mortgage
$263,800
Interest Rate
7.61%
Purchase Details
Closed on
May 12, 1994
Sold by
Sahin I
Bought by
Classic Comm Bldg Cp
Home Financials for this Owner
Home Financials are based on the most recent Mortgage that was taken out on this home.
Original Mortgage
$328,000
Interest Rate
7.93%
Create a Home Valuation Report for This Property
The Home Valuation Report is an in-depth analysis detailing your home's value as well as a comparison with similar homes in the area
Home Values in the Area
Average Home Value in this Area
Purchase History
| Date | Buyer | Sale Price | Title Company |
|---|---|---|---|
| Blumstein Eyal | $655,000 | -- | |
| Orebaugh Howard D | $329,759 | -- | |
| Classic Comm Bldg Cp | $340,000 | -- |
Source: Public Records
Mortgage History
| Date | Status | Borrower | Loan Amount |
|---|---|---|---|
| Previous Owner | Classic Comm Bldg Cp | $263,800 | |
| Previous Owner | Classic Comm Bldg Cp | $328,000 | |
| Closed | Classic Comm Bldg Cp | $255,000 | |
| Closed | Classic Comm Bldg Cp | $32,950 |
Source: Public Records
Tax History Compared to Growth
Tax History
| Year | Tax Paid | Tax Assessment Tax Assessment Total Assessment is a certain percentage of the fair market value that is determined by local assessors to be the total taxable value of land and additions on the property. | Land | Improvement |
|---|---|---|---|---|
| 2025 | $9,373 | $826,200 | $291,100 | $535,100 |
| 2024 | $9,373 | $761,467 | $0 | $0 |
| 2023 | $7,897 | $696,733 | $0 | $0 |
| 2022 | $6,817 | $632,000 | $277,200 | $354,800 |
| 2021 | $6,718 | $632,000 | $277,200 | $354,800 |
| 2020 | $6,718 | $632,000 | $277,200 | $354,800 |
| 2019 | $6,821 | $643,900 | $277,200 | $366,700 |
| 2018 | $6,437 | $610,400 | $0 | $0 |
| 2017 | $6,802 | $576,900 | $0 | $0 |
| 2016 | -- | $543,400 | $0 | $0 |
| 2015 | $6,128 | $543,400 | $0 | $0 |
| 2014 | $6,128 | $543,400 | $0 | $0 |
Source: Public Records
Map
Nearby Homes
- 17411 Pipers Way
- 3800 Cherry Valley Dr
- 3323 Buehler Ct Unit 111
- 4013 Cherry Valley Dr
- 18290 Rolling Meadow Way Unit 4
- 17209 Sandy Knoll Dr
- 4501 Cannes Ln
- 18026 Ohara Cir
- 17004 Cashell Rd
- 3361 Tidewater Ct
- 13 Ohara Ct
- 17403 Old Baltimore Rd
- 18120 Windsor Hill Dr
- 16702 Gooseneck Terrace
- 4706 Bready Rd
- 4710 Bready Rd
- 4807 Bready Rd
- 2835 Seabiscuit Dr
- 18633 Clovercrest Cir
- 4809 Bready Rd
- 3717 Monitor Place
- 17408 Rio Dulce Ct
- 17412 Rio Dulce Ct
- 3718 Monitor Place
- 17404 Rio Dulce Ct
- 3716 Monitor Place
- 3713 Monitor Place
- 17609 Princess Anne Dr
- 17613 Princess Anne Dr
- 3709 Monitor Place
- 17413 Rio Dulce Ct
- 17409 Rio Dulce Ct
- 3714 Monitor Place
- 17517 Lafayette Dr
- 17605 Princess Anne Dr
- 17513 Lafayette Dr
- 17601 Lafayette Dr
- 17405 Rio Dulce Ct
- 17617 Princess Anne Dr
- 17509 Lafayette Dr