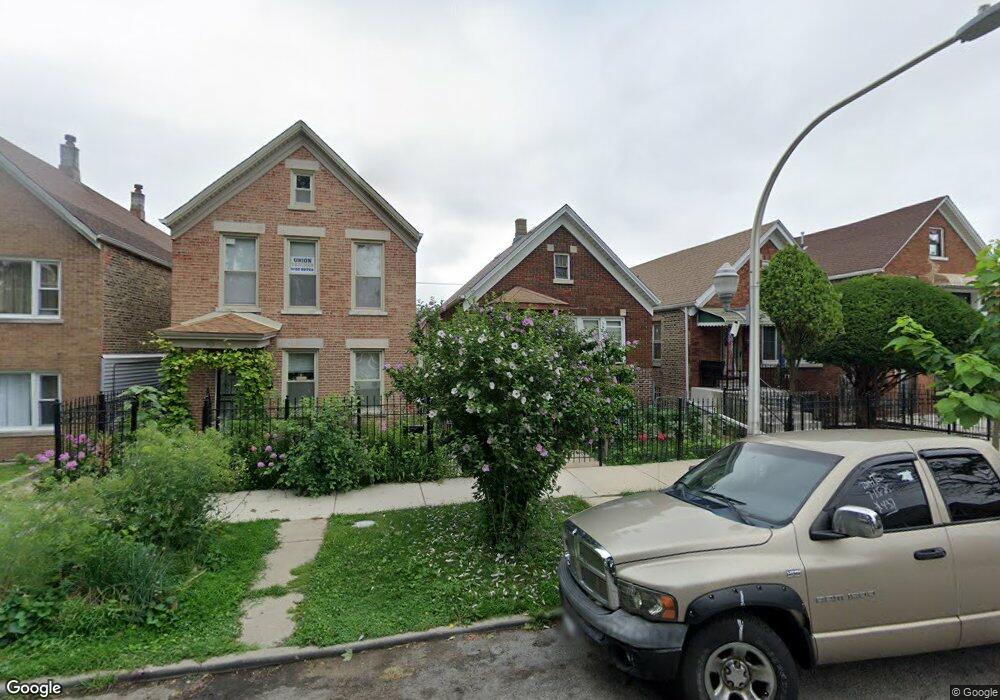
3715 S Winchester Ave Chicago, IL 60609
McKinley Park NeighborhoodEstimated Value: $219,000 - $325,000
2
Beds
1
Bath
600
Sq Ft
$463/Sq Ft
Est. Value
About This Home
This home is located at 3715 S Winchester Ave, Chicago, IL 60609 and is currently estimated at $277,977, approximately $463 per square foot. 3715 S Winchester Ave is a home located in Cook County with nearby schools including Greene N Elementary School, Evergreen Academy Middle School, and Kelly High School.
Ownership History
Date
Name
Owned For
Owner Type
Purchase Details
Closed on
Oct 19, 2007
Sold by
Hernandez Fausto
Bought by
Hernandez Fausto and Hernandez Yolanda
Current Estimated Value
Home Financials for this Owner
Home Financials are based on the most recent Mortgage that was taken out on this home.
Original Mortgage
$141,000
Outstanding Balance
$24,233
Interest Rate
6.33%
Mortgage Type
New Conventional
Estimated Equity
$253,744
Purchase Details
Closed on
Nov 27, 2000
Sold by
Padilla Sabas
Bought by
Hernandez Fausto
Home Financials for this Owner
Home Financials are based on the most recent Mortgage that was taken out on this home.
Original Mortgage
$117,800
Interest Rate
7.86%
Purchase Details
Closed on
Aug 10, 2000
Sold by
Austin Bank Of Chicago
Bought by
Padilla Sabas
Home Financials for this Owner
Home Financials are based on the most recent Mortgage that was taken out on this home.
Original Mortgage
$46,000
Interest Rate
8.16%
Purchase Details
Closed on
Jan 13, 2000
Sold by
Sienkiewicz Helen M
Bought by
Austin Bank Of Chicago and Trust #7302
Create a Home Valuation Report for This Property
The Home Valuation Report is an in-depth analysis detailing your home's value as well as a comparison with similar homes in the area
Home Values in the Area
Average Home Value in this Area
Purchase History
| Date | Buyer | Sale Price | Title Company |
|---|---|---|---|
| Hernandez Fausto | -- | Ticor Title | |
| Hernandez Fausto | $124,000 | -- | |
| Padilla Sabas | $54,000 | Ticor Title Insurance | |
| Austin Bank Of Chicago | $20,500 | -- |
Source: Public Records
Mortgage History
| Date | Status | Borrower | Loan Amount |
|---|---|---|---|
| Open | Hernandez Fausto | $141,000 | |
| Closed | Hernandez Fausto | $117,800 | |
| Previous Owner | Padilla Sabas | $46,000 |
Source: Public Records
Tax History Compared to Growth
Tax History
| Year | Tax Paid | Tax Assessment Tax Assessment Total Assessment is a certain percentage of the fair market value that is determined by local assessors to be the total taxable value of land and additions on the property. | Land | Improvement |
|---|---|---|---|---|
| 2024 | $3,539 | $18,001 | $9,688 | $8,313 |
| 2023 | $3,429 | $20,001 | $7,813 | $12,188 |
| 2022 | $3,429 | $20,001 | $7,813 | $12,188 |
| 2021 | $3,352 | $19,999 | $7,812 | $12,187 |
| 2020 | $1,989 | $11,975 | $6,250 | $5,725 |
| 2019 | $2,027 | $13,455 | $6,250 | $7,205 |
| 2018 | $1,992 | $13,455 | $6,250 | $7,205 |
| 2017 | $2,047 | $12,824 | $5,312 | $7,512 |
| 2016 | $2,082 | $12,824 | $5,312 | $7,512 |
| 2015 | $1,883 | $12,824 | $5,312 | $7,512 |
| 2014 | $1,875 | $12,597 | $3,750 | $8,847 |
| 2013 | $1,827 | $12,597 | $3,750 | $8,847 |
Source: Public Records
Map
Nearby Homes
- 3713 S Damen Ave
- 1932 W 38th St
- 3806 S Wolcott Ave
- 3826 S Honore St
- 3645 S Wood St
- 3714 S Hermitage Ave
- 3738 S Hermitage Ave
- 3516 S Damen Ave
- 3513 S Seeley Ave
- 3624 S Paulina St
- 3616 S Paulina St
- 3535 S Hamilton Ave
- 1758 W 35th St Unit 3R
- 1705 W 35th St
- 2120 W 35th St Unit 101
- 3400 S Wolcott Ave Unit I
- 1835 W 34th St
- 1621 W 38th Place
- 3328 S Damen Ave
- 3330 S Archer Ave
- 3711 S Winchester Ave
- 3711 S Winchester Ave Unit 2
- 3717 S Winchester Ave
- 3709 S Winchester Ave
- 3719 S Winchester Ave
- 3719 S Winchester Ave Unit 2F
- 3719 S Winchester Ave
- 3707 S Winchester Ave
- 3721 S Winchester Ave
- 3723 S Winchester Ave
- 3705 S Winchester Ave
- 3701 S Winchester Ave
- 3727 S Winchester Ave
- 3712 S Wolcott Ave
- 3716 S Wolcott Ave
- 3729 S Winchester Ave
- 3708 S Wolcott Ave
- 3708 S Wolcott Ave
- 3718 S Wolcott Ave
- 3710 S Wolcott Ave