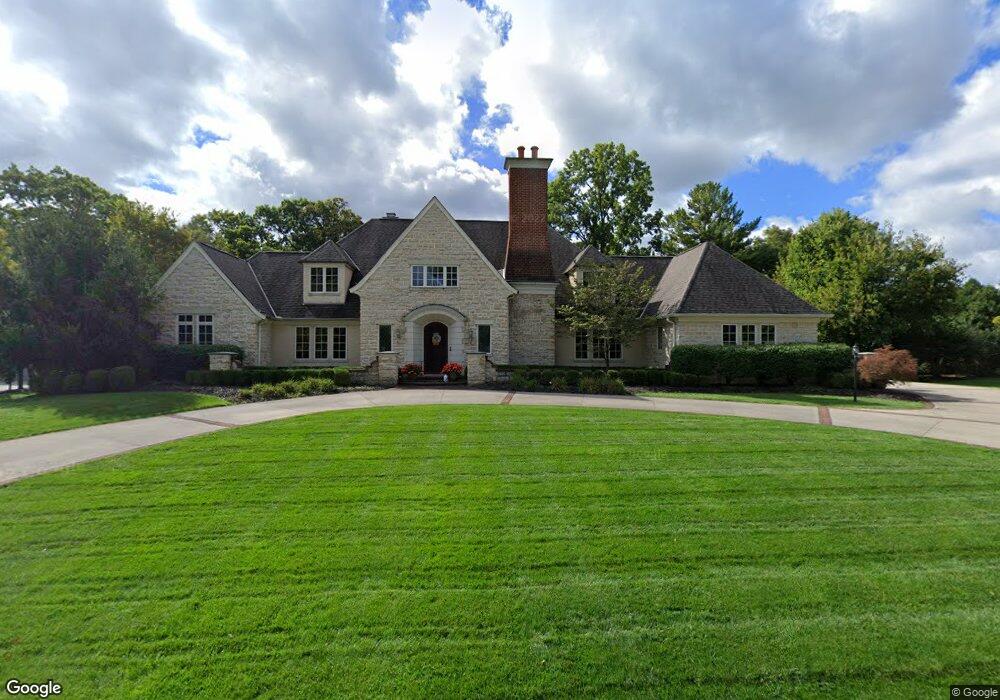
3715 Waldo Place Columbus, OH 43220
Estimated Value: $649,000 - $1,067,580
3
Beds
3
Baths
1,566
Sq Ft
$575/Sq Ft
Est. Value
About This Home
This home is located at 3715 Waldo Place, Columbus, OH 43220 and is currently estimated at $900,895, approximately $575 per square foot. 3715 Waldo Place is a home located in Franklin County with nearby schools including Greensview Elementary School, Hastings Middle School, and Upper Arlington High School.
Ownership History
Date
Name
Owned For
Owner Type
Purchase Details
Closed on
Jul 26, 2013
Sold by
Masters Kathleen M
Bought by
Masters Kathleen M and Masters Revocable T Kathleen M
Current Estimated Value
Purchase Details
Closed on
Jan 6, 2005
Sold by
Peterson Marilyn A
Bought by
Masters Kathleen M
Home Financials for this Owner
Home Financials are based on the most recent Mortgage that was taken out on this home.
Original Mortgage
$228,000
Outstanding Balance
$115,342
Interest Rate
5.78%
Mortgage Type
Purchase Money Mortgage
Estimated Equity
$785,553
Purchase Details
Closed on
Dec 21, 2004
Sold by
Estate Of Carl A Peterson
Bought by
Peterson Marilyn A
Home Financials for this Owner
Home Financials are based on the most recent Mortgage that was taken out on this home.
Original Mortgage
$228,000
Outstanding Balance
$115,342
Interest Rate
5.78%
Mortgage Type
Purchase Money Mortgage
Estimated Equity
$785,553
Purchase Details
Closed on
Nov 2, 1965
Bought by
Peterson Carl A
Create a Home Valuation Report for This Property
The Home Valuation Report is an in-depth analysis detailing your home's value as well as a comparison with similar homes in the area
Home Values in the Area
Average Home Value in this Area
Purchase History
| Date | Buyer | Sale Price | Title Company |
|---|---|---|---|
| Masters Kathleen M | -- | None Available | |
| Masters Kathleen M | $295,000 | Chicago Title Insurance Comp | |
| Peterson Marilyn A | -- | -- | |
| Peterson Carl A | -- | -- |
Source: Public Records
Mortgage History
| Date | Status | Borrower | Loan Amount |
|---|---|---|---|
| Open | Masters Kathleen M | $228,000 | |
| Closed | Masters Kathleen M | $35,000 |
Source: Public Records
Tax History Compared to Growth
Tax History
| Year | Tax Paid | Tax Assessment Tax Assessment Total Assessment is a certain percentage of the fair market value that is determined by local assessors to be the total taxable value of land and additions on the property. | Land | Improvement |
|---|---|---|---|---|
| 2024 | $16,757 | $299,250 | $109,130 | $190,120 |
| 2023 | $16,760 | $299,250 | $109,130 | $190,120 |
| 2022 | $18,756 | $273,010 | $95,660 | $177,350 |
| 2021 | $16,637 | $273,010 | $95,660 | $177,350 |
| 2020 | $22,592 | $372,510 | $95,660 | $276,850 |
| 2019 | $21,095 | $308,780 | $95,660 | $213,120 |
| 2018 | $10,489 | $308,780 | $95,660 | $213,120 |
| 2017 | $20,645 | $308,780 | $95,660 | $213,120 |
| 2016 | $15,551 | $242,060 | $39,690 | $202,370 |
| 2015 | $7,756 | $242,060 | $39,690 | $202,370 |
| 2014 | $15,430 | $242,060 | $39,690 | $202,370 |
| 2013 | $7,754 | $230,545 | $37,800 | $192,745 |
Source: Public Records
Map
Nearby Homes
- 4499 Summit Ridge Rd
- 5055 Slate Run Woods Ct
- 5000 Slate Run Woods Ct
- 5227 Brynwood Dr
- 5322 Darlington Rd Unit E
- 2744 Greystone Dr Unit E
- 5273 Brandy Oaks Ln
- 5275 Brandy Oaks Ln
- 5277 Brandy Oaks Ln
- 4861 Etrick Dr Unit 22
- 5297 Brandy Oaks Ln Unit 5297
- 2491 Calais Way
- 5294 Brandy Oaks Ln
- 3119 Rivermill Dr Unit 24
- 4390 Dublin Rd
- 2231 Atlee Ct Unit 12
- 2560 Chartwell Rd
- 2198 Sandston Rd
- 2522 Gardenia Dr Unit 16C
- 2248 Sandover Rd
- 3695 Waldo Place
- 3725 Waldo Place
- 3700 Waldo Place
- 3720 Waldo Place
- 5050 Squirrel Bend
- 5050 Squirrel Bend Unit R
- 3675 Waldo Place
- 3745 Waldo Place
- 3680 Waldo Place
- 3740 Waldo Place
- 3655 Waldo Place
- 5080 Squirrel Bend
- 0 Waldo Place
- 4469 Summit Ridge Rd
- 3715 Rushmore Dr
- 3765 Waldo Place
- 3695 Rushmore Dr
- 3760 Waldo Place
- 3735 Rushmore Dr
- 4410 Squirrel Bend