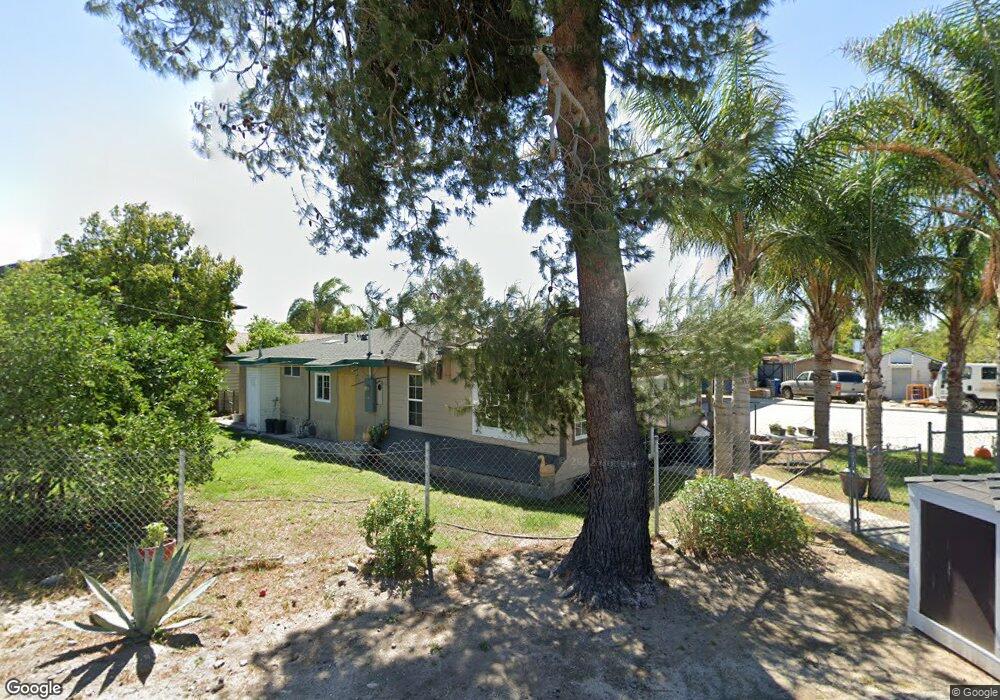
3717 Gray St San Bernardino, CA 92407
Estimated Value: $393,586 - $421,000
2
Beds
1
Bath
868
Sq Ft
$468/Sq Ft
Est. Value
About This Home
This home is located at 3717 Gray St, San Bernardino, CA 92407 and is currently estimated at $406,397, approximately $468 per square foot. 3717 Gray St is a home located in San Bernardino County with nearby schools including Vermont Elementary School, Cesar E. Chavez Middle School, and Arroyo Valley High School.
Ownership History
Date
Name
Owned For
Owner Type
Purchase Details
Closed on
Oct 2, 2003
Sold by
Torres Rodrigo
Bought by
Torres Rodrigo and Torres Amelia
Current Estimated Value
Home Financials for this Owner
Home Financials are based on the most recent Mortgage that was taken out on this home.
Original Mortgage
$93,118
Outstanding Balance
$43,633
Interest Rate
6.27%
Mortgage Type
Purchase Money Mortgage
Estimated Equity
$362,764
Purchase Details
Closed on
Oct 29, 1998
Sold by
Torres Rodrigo
Bought by
Torres Rodrigo and Torres Amelia
Purchase Details
Closed on
May 18, 1998
Sold by
Tuger Scott W
Bought by
Torres Rodrigo
Home Financials for this Owner
Home Financials are based on the most recent Mortgage that was taken out on this home.
Original Mortgage
$62,967
Interest Rate
7.06%
Mortgage Type
FHA
Purchase Details
Closed on
Oct 7, 1997
Sold by
Tuger Linda Kathleen
Bought by
Tuger Scott William
Create a Home Valuation Report for This Property
The Home Valuation Report is an in-depth analysis detailing your home's value as well as a comparison with similar homes in the area
Home Values in the Area
Average Home Value in this Area
Purchase History
| Date | Buyer | Sale Price | Title Company |
|---|---|---|---|
| Torres Rodrigo | -- | Placer Title Company | |
| Torres Rodrigo | -- | -- | |
| Torres Rodrigo | $63,000 | Chicago Title Co | |
| Tuger Scott William | -- | -- |
Source: Public Records
Mortgage History
| Date | Status | Borrower | Loan Amount |
|---|---|---|---|
| Open | Torres Rodrigo | $93,118 | |
| Previous Owner | Torres Rodrigo | $62,967 |
Source: Public Records
Tax History Compared to Growth
Tax History
| Year | Tax Paid | Tax Assessment Tax Assessment Total Assessment is a certain percentage of the fair market value that is determined by local assessors to be the total taxable value of land and additions on the property. | Land | Improvement |
|---|---|---|---|---|
| 2025 | $1,326 | $98,769 | $18,816 | $79,953 |
| 2024 | $1,326 | $96,832 | $18,447 | $78,385 |
| 2023 | $1,291 | $94,933 | $18,085 | $76,848 |
| 2022 | $1,287 | $93,071 | $17,730 | $75,341 |
| 2021 | $1,284 | $91,246 | $17,382 | $73,864 |
| 2020 | $1,282 | $90,311 | $17,204 | $73,107 |
| 2019 | $1,246 | $88,541 | $16,867 | $71,674 |
| 2018 | $1,074 | $86,805 | $16,536 | $70,269 |
| 2017 | $1,039 | $85,103 | $16,212 | $68,891 |
| 2016 | $1,007 | $83,434 | $15,894 | $67,540 |
| 2015 | $1,023 | $82,180 | $15,655 | $66,525 |
| 2014 | $988 | $80,570 | $15,348 | $65,222 |
Source: Public Records
Map
Nearby Homes
- 3552 Bronson St
- 4278 Bronson St
- 3570 Gray St
- 3540 Bronson St
- 4595 Bronson St
- 4528 Cristy Ave
- 2869 Rosarita St
- 3930 Carmelina St
- 2724 June Place
- 2695 Rosarita St
- 3230 Bronson St
- 2455 W 1st Ave
- 2271 Ogden St
- 2236 Ogden St
- 2168 W 1st Ave
- 2527 Allegheny Rd
- 2543 Allegheny Rd
- 2551 Allegheny Rd
- 519 Tucker Ave
- Residence One Plan at River Ranch - Edgestone