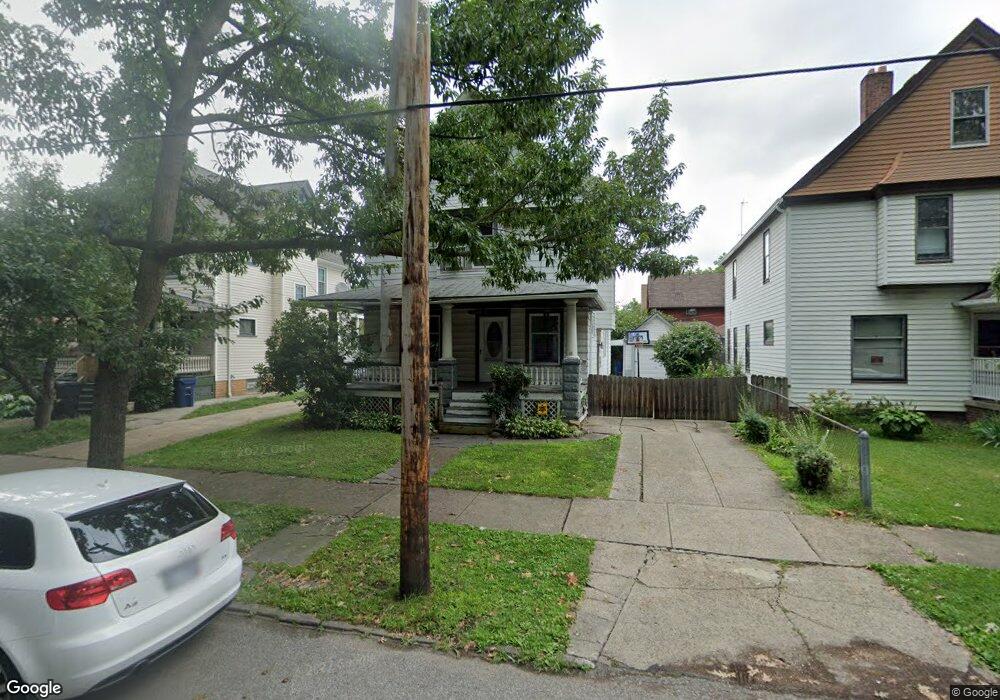
3717 W 36th St Cleveland, OH 44109
Brooklyn Centre NeighborhoodEstimated Value: $131,798 - $194,000
3
Beds
1
Bath
1,666
Sq Ft
$99/Sq Ft
Est. Value
About This Home
This home is located at 3717 W 36th St, Cleveland, OH 44109 and is currently estimated at $165,200, approximately $99 per square foot. 3717 W 36th St is a home located in Cuyahoga County with nearby schools including Benjamin Franklin, Almira Academy, and Anton Grdina School.
Ownership History
Date
Name
Owned For
Owner Type
Purchase Details
Closed on
Nov 22, 2024
Sold by
Zvomuya Katherine S and Zvomuya Vincent T
Bought by
Zvomuya Vincent T
Current Estimated Value
Home Financials for this Owner
Home Financials are based on the most recent Mortgage that was taken out on this home.
Original Mortgage
$101,750
Outstanding Balance
$100,815
Interest Rate
6.54%
Mortgage Type
FHA
Estimated Equity
$64,385
Purchase Details
Closed on
Jul 21, 2005
Sold by
Thompson Jeffrey E and Thompson Wendy S
Bought by
Zvomuya Vincent T and Zvomuya Katherine S
Home Financials for this Owner
Home Financials are based on the most recent Mortgage that was taken out on this home.
Original Mortgage
$113,223
Interest Rate
5.68%
Mortgage Type
FHA
Purchase Details
Closed on
Sep 1, 1993
Sold by
Debick George M
Bought by
Whalen Timothy J
Purchase Details
Closed on
Jan 1, 1975
Bought by
Debick George M
Create a Home Valuation Report for This Property
The Home Valuation Report is an in-depth analysis detailing your home's value as well as a comparison with similar homes in the area
Home Values in the Area
Average Home Value in this Area
Purchase History
| Date | Buyer | Sale Price | Title Company |
|---|---|---|---|
| Zvomuya Vincent T | -- | None Listed On Document | |
| Zvomuya Vincent T | $115,000 | Cleveland Home | |
| Whalen Timothy J | $32,000 | -- | |
| Debick George M | -- | -- |
Source: Public Records
Mortgage History
| Date | Status | Borrower | Loan Amount |
|---|---|---|---|
| Open | Zvomuya Vincent T | $101,750 | |
| Previous Owner | Zvomuya Vincent T | $113,223 |
Source: Public Records
Tax History Compared to Growth
Tax History
| Year | Tax Paid | Tax Assessment Tax Assessment Total Assessment is a certain percentage of the fair market value that is determined by local assessors to be the total taxable value of land and additions on the property. | Land | Improvement |
|---|---|---|---|---|
| 2024 | $2,425 | $36,995 | $6,475 | $30,520 |
| 2023 | $2,185 | $28,810 | $3,750 | $25,060 |
| 2022 | $2,173 | $28,810 | $3,750 | $25,060 |
| 2021 | $2,151 | $28,810 | $3,750 | $25,060 |
| 2020 | $1,929 | $22,330 | $2,910 | $19,430 |
| 2019 | $1,784 | $63,800 | $8,300 | $55,500 |
| 2018 | $1,841 | $22,330 | $2,910 | $19,430 |
| 2017 | $1,920 | $23,280 | $3,120 | $20,160 |
| 2016 | $1,905 | $23,280 | $3,120 | $20,160 |
| 2015 | $2,012 | $23,280 | $3,120 | $20,160 |
| 2014 | $2,012 | $24,500 | $3,290 | $21,210 |
Source: Public Records
Map
Nearby Homes
- 3414 Virginia Ave
- 3609 Riverside Ave
- 3510 Riverside Ave
- 3609 Archwood Ave
- 3719 Mack Ct
- 3812 Archwood Ave
- 3793 W 37th St
- 3820 Riverside Ave
- 3205 Mapledale Ave
- 3719 Poe Ave
- 3794 W 38th St
- 3732 W 41st St
- 3817 Denison Ave
- 3847 W 38th St
- 4123 Archwood Ave
- 3557 W 32nd St
- 3831 W 40th St
- 3407 Daisy Ave
- 3868 W 37th St
- 3844 W 39th St
- 3723 W 36th St
- 3711 W 36th St
- 3506 Virginia Ave
- 3502 Virginia Ave
- 3731 W 36th St
- 3503 Mapledale Ave
- 3707 W 36th St
- 3431 Mapledale Ave
- 3720 W 36th St
- 3735 W 36th St
- 3722 W 36th St
- 3410 Virginia Ave
- 3427 Mapledale Ave
- 3726 W 36th St
- 3708 W 36th St
- 3503 Virginia Ave
- 3730 W 36th St
- 3147 W 36th St
- 3421 Virginia Ave
- 3425 Mapledale Ave