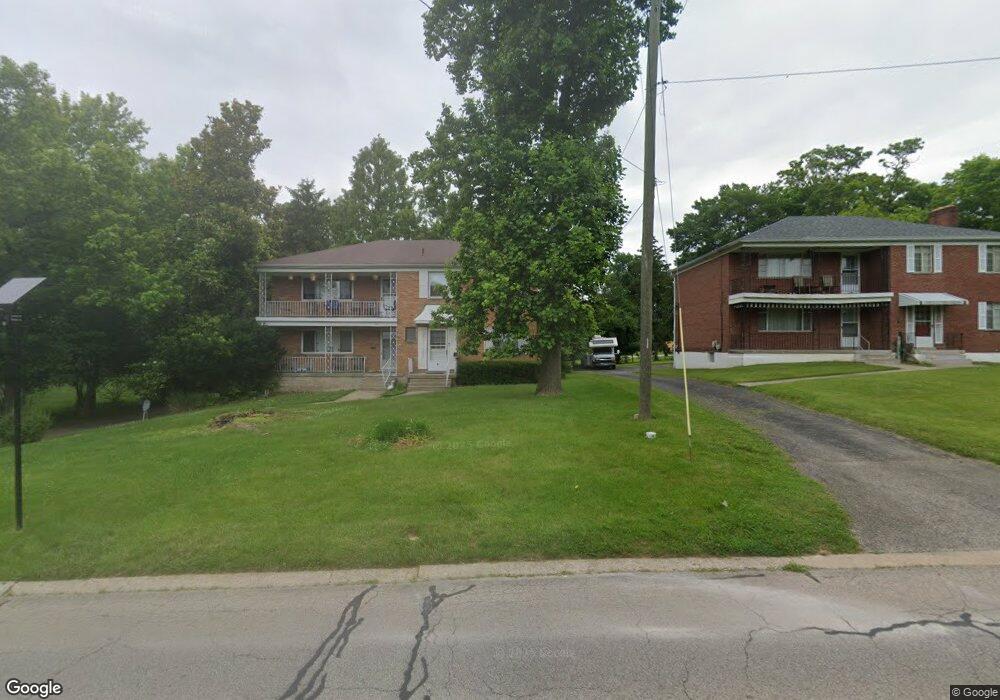
3718 Section Rd Cincinnati, OH 45236
Estimated Value: $392,380 - $410,000
3
Beds
2
Baths
2,248
Sq Ft
$178/Sq Ft
Est. Value
About This Home
This home is located at 3718 Section Rd, Cincinnati, OH 45236 and is currently estimated at $399,845, approximately $177 per square foot. 3718 Section Rd is a home located in Hamilton County with nearby schools including Silverton Paideia Elementary School, Shroder High School, and Clark Montessori High School.
Ownership History
Date
Name
Owned For
Owner Type
Purchase Details
Closed on
Sep 18, 2001
Sold by
Bryant Jana and Bryant Clark
Bought by
Dixon Kenneth C
Current Estimated Value
Home Financials for this Owner
Home Financials are based on the most recent Mortgage that was taken out on this home.
Original Mortgage
$130,000
Outstanding Balance
$48,326
Interest Rate
6.97%
Estimated Equity
$351,519
Purchase Details
Closed on
Apr 4, 2001
Sold by
Metzger Charles H
Bought by
Bryant Jana and Jeffrey Metzger C
Create a Home Valuation Report for This Property
The Home Valuation Report is an in-depth analysis detailing your home's value as well as a comparison with similar homes in the area
Home Values in the Area
Average Home Value in this Area
Purchase History
| Date | Buyer | Sale Price | Title Company |
|---|---|---|---|
| Dixon Kenneth C | $180,000 | -- | |
| Bryant Jana | -- | -- |
Source: Public Records
Mortgage History
| Date | Status | Borrower | Loan Amount |
|---|---|---|---|
| Open | Dixon Kenneth C | $130,000 |
Source: Public Records
Tax History
| Year | Tax Paid | Tax Assessment Tax Assessment Total Assessment is a certain percentage of the fair market value that is determined by local assessors to be the total taxable value of land and additions on the property. | Land | Improvement |
|---|---|---|---|---|
| 2025 | $6,427 | $100,324 | $23,513 | $76,811 |
| 2023 | $6,078 | $100,324 | $23,513 | $76,811 |
| 2022 | $5,500 | $77,036 | $19,856 | $57,180 |
| 2021 | $5,472 | $77,036 | $19,856 | $57,180 |
| 2020 | $5,414 | $77,036 | $19,856 | $57,180 |
| 2019 | $5,302 | $67,575 | $17,416 | $50,159 |
| 2018 | $5,307 | $67,575 | $17,416 | $50,159 |
| 2017 | $5,139 | $67,575 | $17,416 | $50,159 |
| 2016 | $5,563 | $71,050 | $18,984 | $52,066 |
| 2015 | $4,987 | $71,050 | $18,984 | $52,066 |
| 2014 | $5,010 | $71,050 | $18,984 | $52,066 |
| 2013 | $4,672 | $65,184 | $17,416 | $47,768 |
Source: Public Records
Map
Nearby Homes
- 3814 N Broadlawn Cir
- 3911 E Gatewood Ln
- 3533 Amberacres Dr
- 3521 Section Rd
- 6829 Alpine Ave
- 4025 Deer Park Ave
- 3982 Superior Ave
- 7211 Maryland Ave
- 6460 Mchugh Place
- 6470 Crestview Ave
- 6454 Crestview Ave
- 6466 Crestview Ave
- 6508 Coleridge Ave
- 6462 Crestview Ave
- 6458 Crestview Ave
- 7651 Sagamore Dr
- 4155 Home St
- 6501 Coleridge Ave
- 6656 Plainfield Rd
- 4224 North Ave
- 6930 Winding Way
- 3775 S Broadlawn Cir
- 3771 S Broadlawn Cir
- 3767 S Broadlawn Cir
- 3708 Gerdsen Dr
- 3779 S Broadlawn Cir
- 3763 S Broadlawn Cir
- 3706 Gerdsen Dr
- 3710 Gerdsen Dr
- 3759 S Broadlawn Cir
- 3783 S Broadlawn Cir
- 6932 Winding Way
- 3710 Section Rd
- 3758 N Broadlawn Cir
- 3716 Section Rd
- 3714 Section Rd
- 3790 S Broadlawn Cir
- 6934 Winding Way
- 3787 S Broadlawn Cir
- 3762 N Broadlawn Cir
Your Personal Tour Guide
Ask me questions while you tour the home.