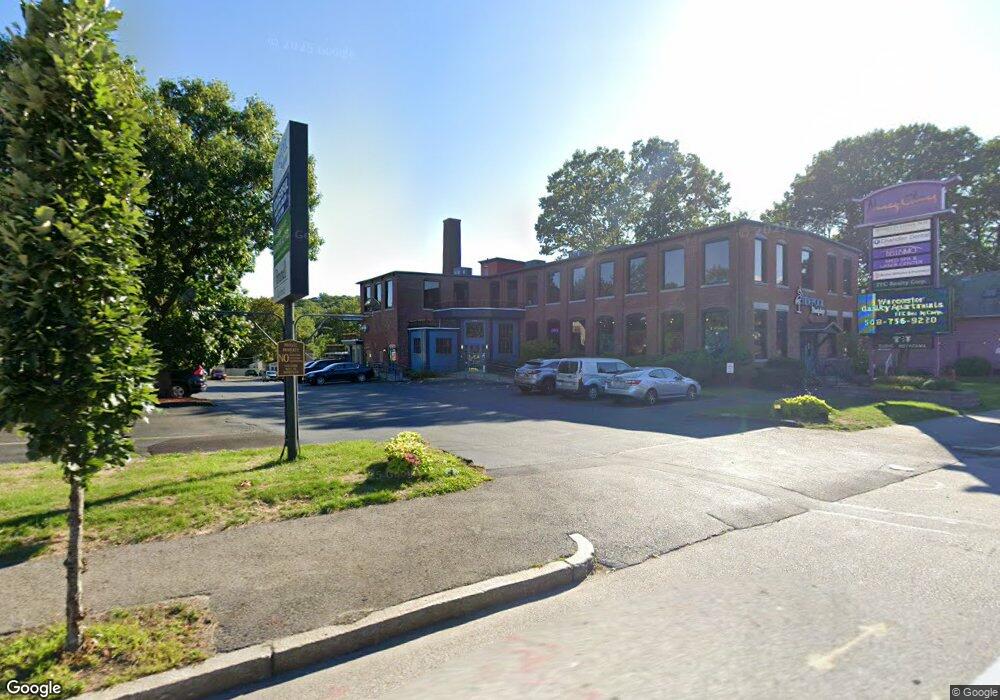
372 Chandler St Unit 1st fl Worcester, MA 01602
Columbus Park NeighborhoodEstimated Value: $3,905,492
--
Bed
--
Bath
21,343
Sq Ft
$183/Sq Ft
Est. Value
About This Home
This home is located at 372 Chandler St Unit 1st fl, Worcester, MA 01602 and is currently estimated at $3,905,492, approximately $182 per square foot. 372 Chandler St Unit 1st fl is a home located in Worcester County with nearby schools including Chandler Magnet, Jacob Hiatt Magnet School, and May Street Elementary School.
Ownership History
Date
Name
Owned For
Owner Type
Purchase Details
Closed on
Dec 14, 2012
Sold by
372 Chandler Corp
Bought by
372 Chandler Llc
Current Estimated Value
Home Financials for this Owner
Home Financials are based on the most recent Mortgage that was taken out on this home.
Original Mortgage
$1,190,000
Outstanding Balance
$827,189
Interest Rate
3.44%
Mortgage Type
Commercial
Estimated Equity
$3,078,303
Purchase Details
Closed on
Nov 30, 1995
Sold by
Harvey Neil R
Bought by
372 Chandler Corp
Purchase Details
Closed on
Mar 23, 1995
Sold by
Wrd Rlty Corp
Bought by
Harvey Neil
Home Financials for this Owner
Home Financials are based on the most recent Mortgage that was taken out on this home.
Original Mortgage
$100,000
Interest Rate
8.78%
Mortgage Type
Purchase Money Mortgage
Create a Home Valuation Report for This Property
The Home Valuation Report is an in-depth analysis detailing your home's value as well as a comparison with similar homes in the area
Home Values in the Area
Average Home Value in this Area
Purchase History
| Date | Buyer | Sale Price | Title Company |
|---|---|---|---|
| 372 Chandler Llc | $1,700,000 | -- | |
| 372 Chandler Corp | $118,000 | -- | |
| Harvey Neil | $118,000 | -- |
Source: Public Records
Mortgage History
| Date | Status | Borrower | Loan Amount |
|---|---|---|---|
| Open | 372 Chandler Llc | $1,190,000 | |
| Previous Owner | Harvey Neil | $725,000 | |
| Previous Owner | Harvey Neil | $100,000 |
Source: Public Records
Tax History Compared to Growth
Tax History
| Year | Tax Paid | Tax Assessment Tax Assessment Total Assessment is a certain percentage of the fair market value that is determined by local assessors to be the total taxable value of land and additions on the property. | Land | Improvement |
|---|---|---|---|---|
| 2025 | $71,980 | $2,515,900 | $611,300 | $1,904,600 |
| 2024 | $70,561 | $2,348,900 | $611,300 | $1,737,600 |
| 2023 | $62,379 | $1,995,500 | $531,600 | $1,463,900 |
| 2022 | $63,040 | $1,891,400 | $531,600 | $1,359,800 |
| 2021 | $65,366 | $1,805,700 | $381,500 | $1,424,200 |
| 2020 | $63,488 | $1,805,700 | $381,500 | $1,424,200 |
| 2019 | $61,721 | $1,768,500 | $371,300 | $1,397,200 |
| 2018 | $59,753 | $1,755,900 | $371,300 | $1,384,600 |
| 2017 | $57,822 | $1,755,900 | $371,300 | $1,384,600 |
| 2016 | $56,074 | $1,650,200 | $326,700 | $1,323,500 |
| 2015 | $52,361 | $1,650,200 | $326,700 | $1,323,500 |
| 2014 | $51,683 | $1,676,400 | $326,700 | $1,349,700 |
Source: Public Records
Map
Nearby Homes
- 372 Chandler St
- 341 Lovell St
- 376 Chandler St
- 4 Walworth St
- 362 Chandler St Unit 3,4
- 337 Lovell St
- 6 Walworth St
- 8 Walworth St
- 8 Walworth St Unit 1
- 17 Walworth St
- 378 Chandler St
- 378 Chandler St Unit 1
- 16 Walworth St
- 19 Walworth St
- 329 Lovell St
- 4 Geneva St
- 6 Geneva St
- 6 Geneva St Unit 2
- 346 Lovell St Unit 2
- 325 Lovell St