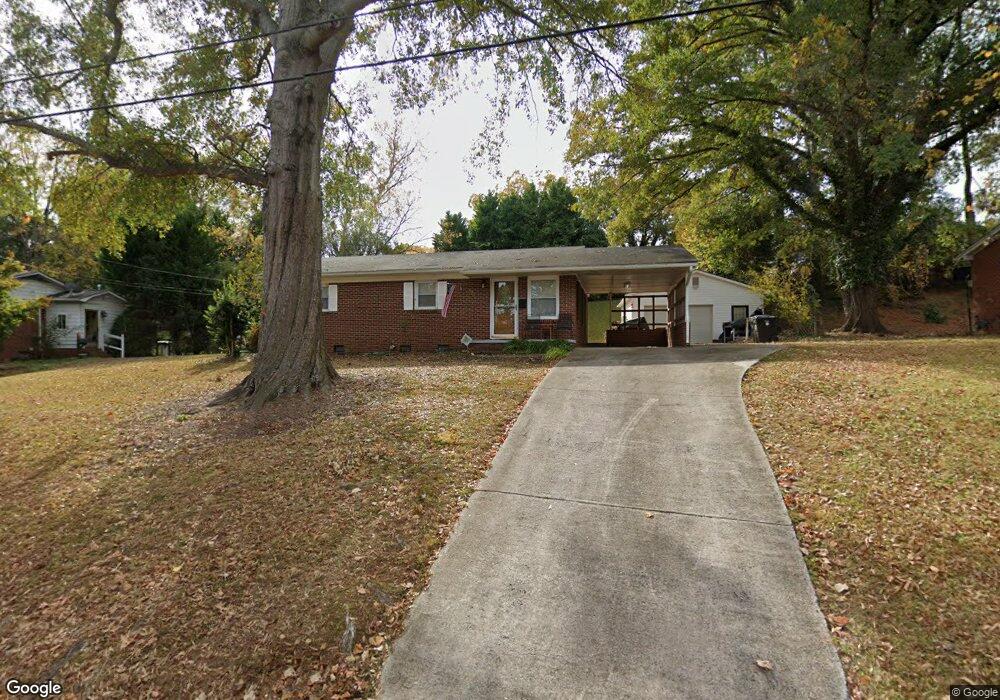
372 Hatley Cir NE Concord, NC 28025
Estimated Value: $234,000 - $275,000
3
Beds
1
Bath
1,131
Sq Ft
$220/Sq Ft
Est. Value
About This Home
This home is located at 372 Hatley Cir NE, Concord, NC 28025 and is currently estimated at $249,263, approximately $220 per square foot. 372 Hatley Cir NE is a home located in Cabarrus County with nearby schools including W.M. Irvin Elementary School, Concord Middle School, and Concord High School.
Ownership History
Date
Name
Owned For
Owner Type
Purchase Details
Closed on
Sep 13, 2023
Sold by
Croft James D
Bought by
Shaiban Saeed Saleh
Current Estimated Value
Home Financials for this Owner
Home Financials are based on the most recent Mortgage that was taken out on this home.
Original Mortgage
$187,000
Outstanding Balance
$182,989
Interest Rate
6.9%
Mortgage Type
New Conventional
Estimated Equity
$66,274
Purchase Details
Closed on
Mar 7, 2008
Sold by
Hartman Samuel Mathew and Hartman Kristina D
Bought by
Croft James D
Home Financials for this Owner
Home Financials are based on the most recent Mortgage that was taken out on this home.
Original Mortgage
$119,000
Interest Rate
5.46%
Mortgage Type
Purchase Money Mortgage
Purchase Details
Closed on
Aug 1, 1996
Bought by
Hartman Samuel Mathew
Create a Home Valuation Report for This Property
The Home Valuation Report is an in-depth analysis detailing your home's value as well as a comparison with similar homes in the area
Home Values in the Area
Average Home Value in this Area
Purchase History
| Date | Buyer | Sale Price | Title Company |
|---|---|---|---|
| Shaiban Saeed Saleh | $220,000 | None Listed On Document | |
| Croft James D | $119,000 | None Available | |
| Hartman Samuel Mathew | $81,000 | -- |
Source: Public Records
Mortgage History
| Date | Status | Borrower | Loan Amount |
|---|---|---|---|
| Open | Shaiban Saeed Saleh | $187,000 | |
| Previous Owner | Croft James D | $119,000 |
Source: Public Records
Tax History Compared to Growth
Tax History
| Year | Tax Paid | Tax Assessment Tax Assessment Total Assessment is a certain percentage of the fair market value that is determined by local assessors to be the total taxable value of land and additions on the property. | Land | Improvement |
|---|---|---|---|---|
| 2025 | $2,187 | $219,620 | $57,200 | $162,420 |
| 2024 | $2,187 | $219,620 | $57,200 | $162,420 |
| 2023 | $1,349 | $110,560 | $27,500 | $83,060 |
| 2022 | $1,349 | $110,560 | $27,500 | $83,060 |
| 2021 | $1,349 | $110,560 | $27,500 | $83,060 |
| 2020 | $1,349 | $110,560 | $27,500 | $83,060 |
| 2019 | $1,011 | $82,890 | $13,200 | $69,690 |
| 2018 | $995 | $82,890 | $13,200 | $69,690 |
| 2017 | $978 | $82,890 | $13,200 | $69,690 |
| 2016 | $580 | $101,000 | $22,000 | $79,000 |
| 2015 | $1,192 | $101,000 | $22,000 | $79,000 |
| 2014 | $1,192 | $101,000 | $22,000 | $79,000 |
Source: Public Records
Map
Nearby Homes
- 128 Wilson St NE
- 103 Wilson St NE
- 99 Shamrock St NE
- 233 Jefferson Ave NE
- 105 Edgewood Cir NE
- 247 Cabarrus Ave E
- 336 Hamilton Dr NE
- 87 Edgewood Ave NE
- 333 Hillandale St NE
- 36 Rich Place NE
- 184 Cabarrus Ave E
- 396 Cameron Ave NE
- 59 Mckinnon Ave NE
- 47 Edgewood Ave NE Unit B-8
- 159 Madison Ave NE
- 410 Cameron Ave NE
- 64 Brumley Ave NE
- 75 Woodsdale Place SE
- 653 Camrose Cir NE
- 649 Camrose Cir NE
- 360 Hatley Cir NE
- 380 Hatley Cir NE
- 352 Hatley Cir NE
- 166 Wilson St NE
- 172 Wilson St NE
- 371 Hatley Cir NE
- 160 Wilson St NE
- 178 Wilson St NE
- 388 Hatley Cir NE
- 387 Hatley Cir NE
- 156 Wilson St NE
- 188 Wilson St NE
- 348 Hatley Cir NE
- 347 Hatley Cir NE
- 395 Hatley Cir NE
- 291 Hatley Cir NE
- 265 Hatley Cir NE
- 138 Wilson St NE
- 198 Wilson St NE
- 331 Hatley Cir NE