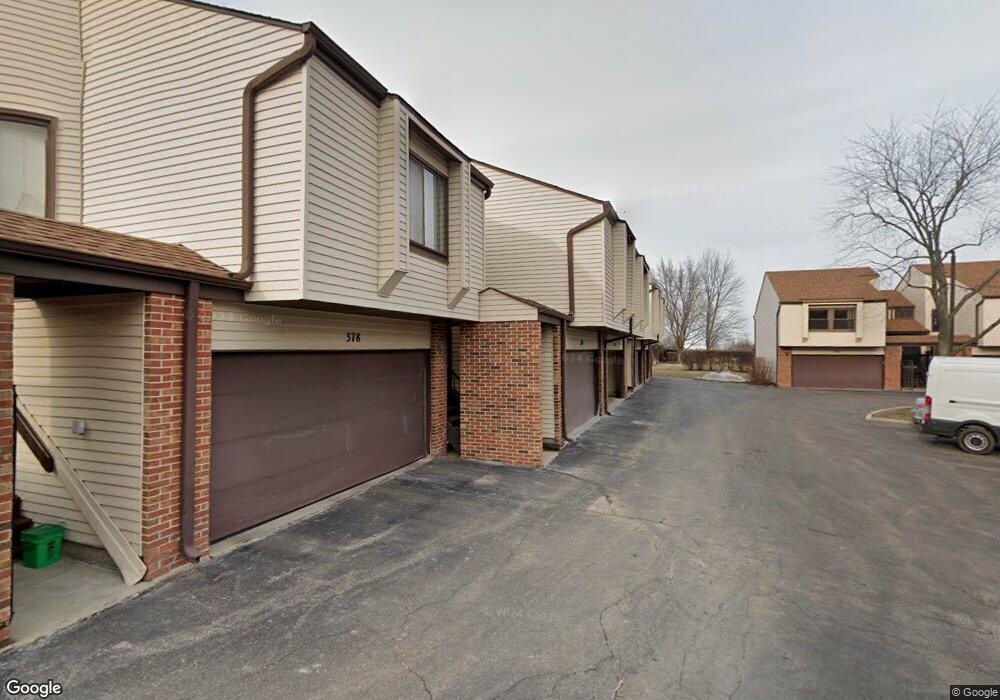
372 Juniper Tree Ct Unit 3 Hoffman Estates, IL 60169
South Hoffman Estates NeighborhoodEstimated Value: $340,790 - $356,000
4
Beds
2
Baths
1,604
Sq Ft
$217/Sq Ft
Est. Value
About This Home
This home is located at 372 Juniper Tree Ct Unit 3, Hoffman Estates, IL 60169 and is currently estimated at $348,198, approximately $217 per square foot. 372 Juniper Tree Ct Unit 3 is a home located in Cook County with nearby schools including Lakeview Elementary School, Helen Keller Junior High School, and J B Conant High School.
Ownership History
Date
Name
Owned For
Owner Type
Purchase Details
Closed on
Nov 25, 2002
Sold by
Jankiewicz Jolanta
Bought by
Thelwell Deon
Current Estimated Value
Home Financials for this Owner
Home Financials are based on the most recent Mortgage that was taken out on this home.
Original Mortgage
$141,600
Outstanding Balance
$54,841
Interest Rate
5.37%
Mortgage Type
Unknown
Estimated Equity
$293,357
Purchase Details
Closed on
Jul 27, 2000
Sold by
Washington Mutual Bank Fa
Bought by
Jankiewicz Jolanta
Home Financials for this Owner
Home Financials are based on the most recent Mortgage that was taken out on this home.
Original Mortgage
$91,500
Interest Rate
8.37%
Mortgage Type
Seller Take Back
Purchase Details
Closed on
Apr 10, 2000
Sold by
Crawford Jack L
Bought by
Washington Mutual Bank Fa and Home Savings Of America Fsb
Purchase Details
Closed on
Dec 23, 1997
Sold by
Crawford Susan J
Bought by
Crawford Jack L
Create a Home Valuation Report for This Property
The Home Valuation Report is an in-depth analysis detailing your home's value as well as a comparison with similar homes in the area
Home Values in the Area
Average Home Value in this Area
Purchase History
| Date | Buyer | Sale Price | Title Company |
|---|---|---|---|
| Thelwell Deon | $177,000 | -- | |
| Jankiewicz Jolanta | $122,000 | First American Title | |
| Washington Mutual Bank Fa | -- | -- | |
| Crawford Jack L | -- | -- |
Source: Public Records
Mortgage History
| Date | Status | Borrower | Loan Amount |
|---|---|---|---|
| Open | Thelwell Deon | $141,600 | |
| Previous Owner | Jankiewicz Jolanta | $91,500 |
Source: Public Records
Tax History
| Year | Tax Paid | Tax Assessment Tax Assessment Total Assessment is a certain percentage of the fair market value that is determined by local assessors to be the total taxable value of land and additions on the property. | Land | Improvement |
|---|---|---|---|---|
| 2025 | $6,169 | $29,000 | $1,543 | $27,457 |
| 2024 | $6,169 | $23,419 | $3,501 | $19,918 |
| 2023 | $5,939 | $23,419 | $3,501 | $19,918 |
| 2022 | $5,939 | $23,419 | $3,501 | $19,918 |
| 2021 | $4,704 | $17,369 | $1,543 | $15,826 |
| 2020 | $4,668 | $17,369 | $1,543 | $15,826 |
| 2019 | $4,710 | $19,516 | $1,543 | $17,973 |
| 2018 | $4,529 | $17,323 | $1,286 | $16,037 |
| 2017 | $4,467 | $17,323 | $1,286 | $16,037 |
| 2016 | $6,143 | $23,118 | $1,286 | $21,832 |
| 2015 | $5,559 | $19,931 | $1,125 | $18,806 |
| 2014 | $5,478 | $19,931 | $1,125 | $18,806 |
| 2013 | $5,319 | $19,931 | $1,125 | $18,806 |
Source: Public Records
Map
Nearby Homes
- 367 Juniper Tree Ct Unit 3
- 945 Morton St
- 368 Willow Tree Ct
- 988 Butter Creek Ct Unit 4ND
- 860 Olive St
- 600 Baxter Ln
- 600 Mesa Dr Unit 103
- 555 Heritage Dr Unit 315
- 829 Linden Cir
- 630 Bode Rd
- 625 Morton St
- 1180 Meadow Ln Unit 6306
- 660 Flagstaff Ln
- 720 Hill Dr Unit 8303
- 1045 Higgins Quarters Dr Unit 4-101
- 1025 Higgins Quarters Dr Unit 4-109
- 730 Hill Dr Unit 9205
- 670 Lakeview Ln
- 345 Maricopa Ln
- 480 Illinois Blvd
- 370 Juniper Tree Ct
- 376 Juniper Tree Ct
- 378 Juniper Tree Ct
- 371 Cedar Tree Ct Unit 3
- 366 Juniper Tree Ct
- 366 Juniper Tree Ct Unit 3
- 369 Cedar Tree Ct
- 373 Cedar Tree Ct
- 364 Juniper Tree Ct
- 367 Cedar Tree Ct
- 375 Cedar Tree Ct
- 925 Spring Mill Dr
- 362 Juniper Tree Ct
- 377 Juniper Tree Ct
- 365 Cedar Tree Ct
- 929 Spring Mill Dr Unit 3
- 929 Spring Mill Dr Unit 929
- 377 Cedar Tree Ct Unit 3
- 375 Juniper Tree Ct Unit 3
- 360 Juniper Tree Ct Unit 3
Your Personal Tour Guide
Ask me questions while you tour the home.