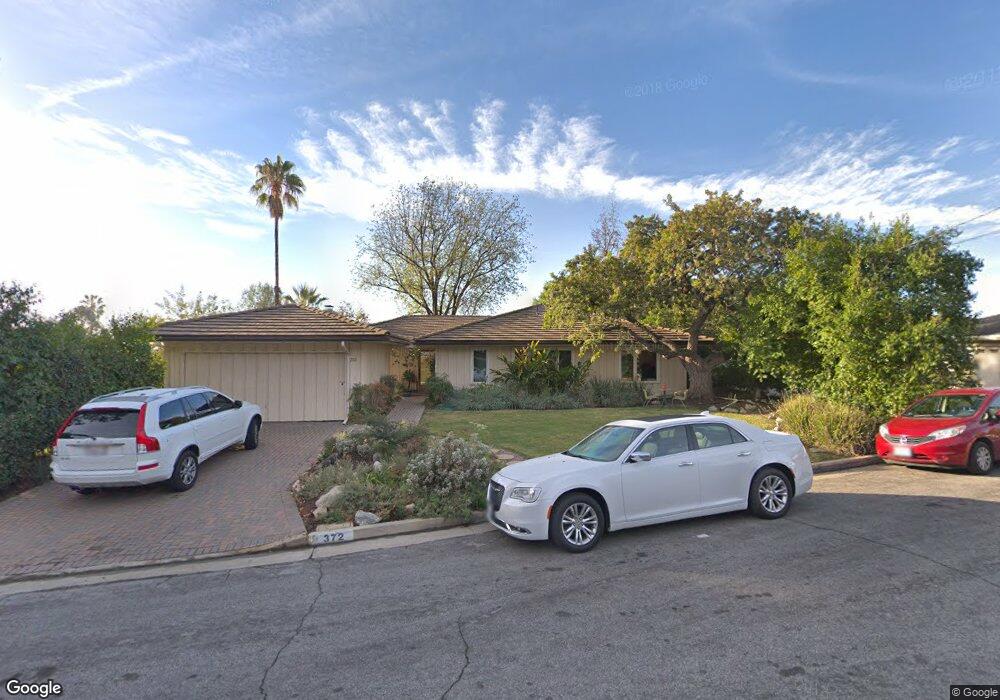
372 Mellow Ln La Canada Flintridge, CA 91011
Estimated Value: $1,986,745 - $2,327,000
4
Beds
2
Baths
1,776
Sq Ft
$1,226/Sq Ft
Est. Value
About This Home
This home is located at 372 Mellow Ln, La Canada Flintridge, CA 91011 and is currently estimated at $2,177,436, approximately $1,226 per square foot. 372 Mellow Ln is a home located in Los Angeles County with nearby schools including Paradise Canyon Elementary School, La Canada High School, and La Canada Preparatory School.
Ownership History
Date
Name
Owned For
Owner Type
Purchase Details
Closed on
May 22, 2020
Sold by
Standley Shaun P and Standley Paula M
Bought by
Standley Shaun P and Standley Paula M
Current Estimated Value
Purchase Details
Closed on
Aug 2, 2012
Sold by
Standley Shaun and Standley Paula M
Bought by
Standley Shaun P and Standley Paula M
Home Financials for this Owner
Home Financials are based on the most recent Mortgage that was taken out on this home.
Original Mortgage
$240,000
Outstanding Balance
$38,383
Interest Rate
3.62%
Mortgage Type
New Conventional
Estimated Equity
$2,139,053
Purchase Details
Closed on
Sep 9, 2009
Sold by
The George Kenneth & Doris Brosseit Full
Bought by
Standley Shaun Patrick and Standley Paula Marchioni
Home Financials for this Owner
Home Financials are based on the most recent Mortgage that was taken out on this home.
Original Mortgage
$250,000
Interest Rate
5.08%
Mortgage Type
New Conventional
Create a Home Valuation Report for This Property
The Home Valuation Report is an in-depth analysis detailing your home's value as well as a comparison with similar homes in the area
Home Values in the Area
Average Home Value in this Area
Purchase History
| Date | Buyer | Sale Price | Title Company |
|---|---|---|---|
| Standley Shaun P | -- | None Available | |
| Standley Shaun P | -- | Lsi | |
| Standley Shaun Patrick | $940,000 | Equity Title Company |
Source: Public Records
Mortgage History
| Date | Status | Borrower | Loan Amount |
|---|---|---|---|
| Open | Standley Shaun P | $240,000 | |
| Closed | Standley Shaun Patrick | $250,000 |
Source: Public Records
Tax History Compared to Growth
Tax History
| Year | Tax Paid | Tax Assessment Tax Assessment Total Assessment is a certain percentage of the fair market value that is determined by local assessors to be the total taxable value of land and additions on the property. | Land | Improvement |
|---|---|---|---|---|
| 2025 | $13,891 | $1,213,360 | $970,694 | $242,666 |
| 2024 | $13,891 | $1,189,569 | $951,661 | $237,908 |
| 2023 | $13,505 | $1,166,245 | $933,001 | $233,244 |
| 2022 | $13,014 | $1,143,378 | $914,707 | $228,671 |
| 2021 | $12,912 | $1,120,960 | $896,772 | $224,188 |
| 2019 | $12,521 | $1,087,714 | $870,174 | $217,540 |
| 2018 | $12,245 | $1,066,387 | $853,112 | $213,275 |
| 2016 | $12,382 | $1,024,981 | $819,986 | $204,995 |
| 2015 | $12,219 | $1,009,586 | $807,670 | $201,916 |
| 2014 | $12,055 | $989,810 | $791,849 | $197,961 |
Source: Public Records
Map
Nearby Homes
- 5311 Pali Point Ln
- 5213 Diamond Point Rd
- 4826 Indianola Way
- 5419 Godbey Dr
- 4537 Indianola Way
- 5117 Stoneglen Rd
- 4544 Daleridge Rd
- 4428 Oakwood Ave
- 909 Coral Way
- 500 Georgian Rd
- 4257 Chula Senda Ln
- 4825 Angeles Crest Hwy
- 4901 Angeles Crest Cir
- 4031 Canyon Dell Dr
- 848 Greenridge Dr
- 4156 Aralia Rd
- 5805 Briartree Dr
- 5148 Angeles Crest Hwy
- 4369 El Prieto Rd
- 4304 Chevy Chase Dr
- 362 Mellow Ln
- 376 Mellow Ln
- 5015 Redwillow Ln
- 350 Mellow Ln
- 378 Mellow Ln
- 371 Mellow Ln
- 367 Mellow Ln
- 367 Knight Way
- 377 Mellow Ln
- 373 Knight Way
- 357 Knight Way
- 361 Mellow Ln
- 379 Mellow Ln
- 379 Knight Way
- 357 Mellow Ln
- 340 Mellow Ln
- 411 Paulette Place
- 5045 Redwillow Ln
- 415 Paulette Place
- 418 Noren St