372 N 900 E Bountiful, UT 84010
Estimated Value: $450,000 - $511,000
2
Beds
2
Baths
1,749
Sq Ft
$275/Sq Ft
Est. Value
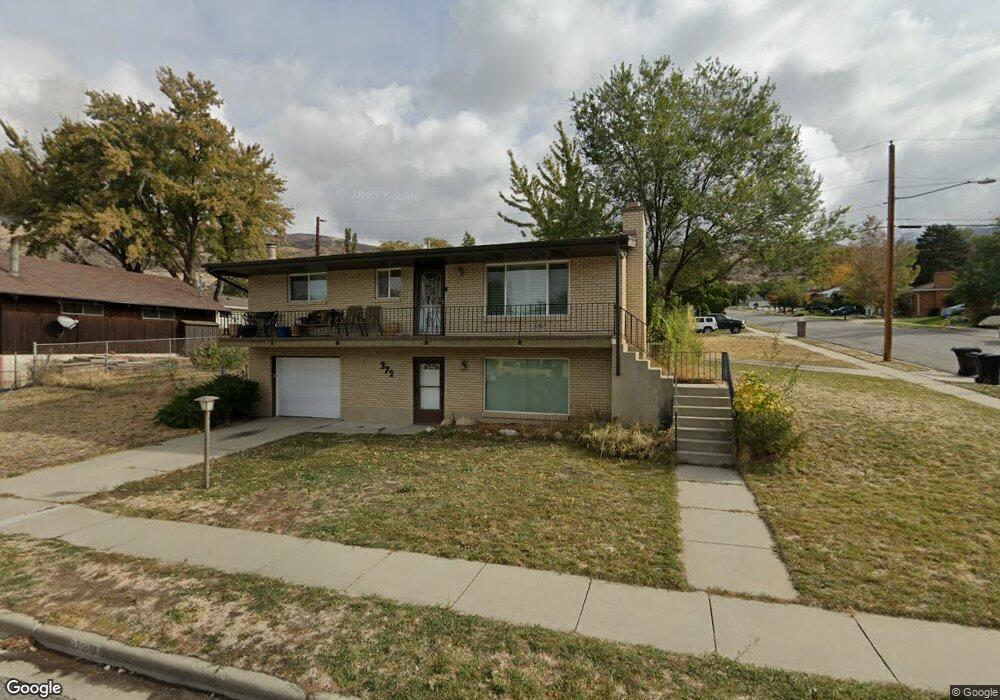
About This Home
This home is located at 372 N 900 E, Bountiful, UT 84010 and is currently estimated at $481,838, approximately $275 per square foot. 372 N 900 E is a home located in Davis County with nearby schools including Holbrook Elementary School, Millcreek Junior High School, and Bountiful High School.
Ownership History
Date
Name
Owned For
Owner Type
Purchase Details
Closed on
Apr 15, 2009
Sold by
Castro Isaac
Bought by
Kelly Sean P and Kelly Jennifer A
Current Estimated Value
Home Financials for this Owner
Home Financials are based on the most recent Mortgage that was taken out on this home.
Original Mortgage
$173,794
Outstanding Balance
$110,744
Interest Rate
5.17%
Mortgage Type
FHA
Estimated Equity
$371,094
Purchase Details
Closed on
Feb 27, 2006
Sold by
Larson Floyd R
Bought by
Castro Isaac
Create a Home Valuation Report for This Property
The Home Valuation Report is an in-depth analysis detailing your home's value as well as a comparison with similar homes in the area
Purchase History
| Date | Buyer | Sale Price | Title Company |
|---|---|---|---|
| Kelly Sean P | -- | Equity Title Ins Agency Inc | |
| Castro Isaac | -- | Backman Title Services |
Source: Public Records
Mortgage History
| Date | Status | Borrower | Loan Amount |
|---|---|---|---|
| Open | Kelly Sean P | $173,794 |
Source: Public Records
Tax History
| Year | Tax Paid | Tax Assessment Tax Assessment Total Assessment is a certain percentage of the fair market value that is determined by local assessors to be the total taxable value of land and additions on the property. | Land | Improvement |
|---|---|---|---|---|
| 2025 | $2,680 | $242,000 | $115,825 | $126,175 |
| 2024 | $2,512 | $235,950 | $106,958 | $128,992 |
| 2023 | $2,545 | $410,000 | $191,753 | $218,247 |
| 2022 | $2,536 | $237,600 | $101,805 | $135,795 |
| 2021 | $2,141 | $305,000 | $151,127 | $153,873 |
| 2020 | $1,892 | $270,000 | $137,658 | $132,342 |
| 2019 | $2,006 | $268,000 | $140,494 | $127,506 |
| 2018 | $1,761 | $241,000 | $129,836 | $111,164 |
| 2016 | $1,458 | $103,180 | $39,226 | $63,954 |
| 2015 | $1,373 | $95,260 | $42,349 | $52,911 |
| 2014 | $1,392 | $99,855 | $42,349 | $57,506 |
| 2013 | -- | $77,859 | $50,916 | $26,943 |
Source: Public Records
Map
Nearby Homes
- 129 N 800 E
- 6 N 800 E
- 683 E 100 N
- 908 Northern Hills Dr Unit 3
- 933 Northern Hills Cir
- 513 N 400 E Unit 14B
- 1138 Briggs Dr
- 453 N 400 E Unit 7-D
- 456 E 500 S
- 1342 E Skyline Dr N Unit 30
- 978 N 170 E
- 520 S Orchard Dr Unit 17
- 255 E 400 S
- 49 E 200 N Unit 4
- 41 E 200 N Unit 6
- 17 E 400 N Unit 19B
- 55 E 200 N Unit 2
- 214 E 1250 N
- 51 E 200 N Unit 3
- 275 E Peach Ln S
Your Personal Tour Guide
Ask me questions while you tour the home.