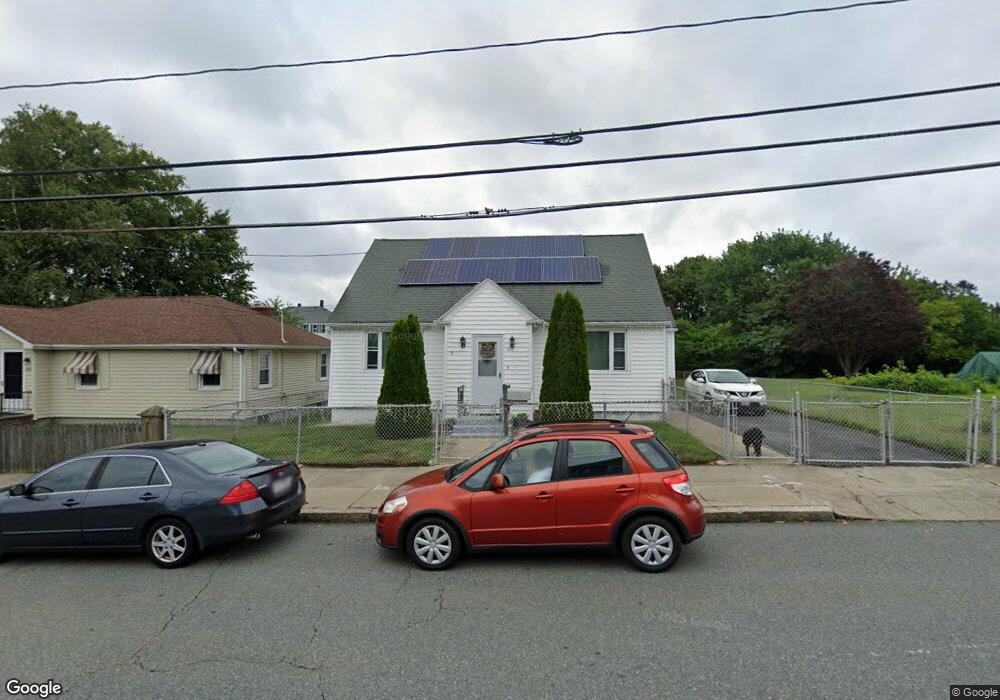
372 Slade St Fall River, MA 02724
Sandy Beach NeighborhoodEstimated Value: $404,000 - $450,000
3
Beds
3
Baths
1,706
Sq Ft
$248/Sq Ft
Est. Value
About This Home
This home is located at 372 Slade St, Fall River, MA 02724 and is currently estimated at $423,390, approximately $248 per square foot. 372 Slade St is a home located in Bristol County with nearby schools including Carlton M. Viveiros Elementary School, Matthew J. Kuss Middle School, and B M C Durfee High School.
Ownership History
Date
Name
Owned For
Owner Type
Purchase Details
Closed on
Jun 23, 2004
Sold by
Dealmeida Edna T
Bought by
Almeida Edna T and Almeida Marcos T
Current Estimated Value
Home Financials for this Owner
Home Financials are based on the most recent Mortgage that was taken out on this home.
Original Mortgage
$137,500
Interest Rate
6.32%
Mortgage Type
Purchase Money Mortgage
Purchase Details
Closed on
Jun 2, 1993
Sold by
Barlow David E and Bardow Violet B
Bought by
Dealmeida Arlinda T and Dealmeida Edna J
Home Financials for this Owner
Home Financials are based on the most recent Mortgage that was taken out on this home.
Original Mortgage
$90,000
Interest Rate
7.33%
Mortgage Type
Purchase Money Mortgage
Purchase Details
Closed on
Sep 10, 1987
Sold by
Medeiros Manuel C
Bought by
Square Deal Cafe Inc
Create a Home Valuation Report for This Property
The Home Valuation Report is an in-depth analysis detailing your home's value as well as a comparison with similar homes in the area
Home Values in the Area
Average Home Value in this Area
Purchase History
| Date | Buyer | Sale Price | Title Company |
|---|---|---|---|
| Almeida Edna T | -- | -- | |
| Dealmeida Arlinda T | $100,000 | -- | |
| Square Deal Cafe Inc | $35,000 | -- |
Source: Public Records
Mortgage History
| Date | Status | Borrower | Loan Amount |
|---|---|---|---|
| Open | Square Deal Cafe Inc | $189,323 | |
| Closed | Square Deal Cafe Inc | $195,461 | |
| Closed | Square Deal Cafe Inc | $137,500 | |
| Previous Owner | Square Deal Cafe Inc | $90,000 |
Source: Public Records
Tax History
| Year | Tax Paid | Tax Assessment Tax Assessment Total Assessment is a certain percentage of the fair market value that is determined by local assessors to be the total taxable value of land and additions on the property. | Land | Improvement |
|---|---|---|---|---|
| 2025 | $3,847 | $336,000 | $127,100 | $208,900 |
| 2024 | $3,632 | $316,100 | $122,300 | $193,800 |
| 2023 | $3,555 | $289,700 | $104,800 | $184,900 |
| 2022 | $3,142 | $249,000 | $95,300 | $153,700 |
| 2021 | $2,965 | $214,400 | $88,200 | $126,200 |
| 2020 | $2,779 | $192,300 | $84,400 | $107,900 |
| 2019 | $2,681 | $183,900 | $80,400 | $103,500 |
| 2018 | $2,563 | $175,300 | $78,900 | $96,400 |
| 2017 | $2,451 | $175,100 | $80,500 | $94,600 |
| 2016 | $2,362 | $173,300 | $83,800 | $89,500 |
| 2015 | $2,221 | $169,800 | $80,700 | $89,100 |
| 2014 | $2,190 | $174,100 | $85,000 | $89,100 |
Source: Public Records
Map
Nearby Homes
- 464 Birch St
- 245 Dwelly St
- 609 King Philip St
- 20 Wilcox St
- 1846 S Main St
- 1852 S Main St
- 15 Higgins St
- 234 Kilburn St
- 57 Larouche St
- 1334 S Main St
- 917 Dwelly St
- 1273-1279 S Main St
- 616 Woodman St
- 126 Wheeler St
- 2229 S Main St
- 344-354 E Main St
- 70 Brown St
- 219 Montaup St
- 240 Montaup St
- 71 Mystic St Unit 3
Your Personal Tour Guide
Ask me questions while you tour the home.