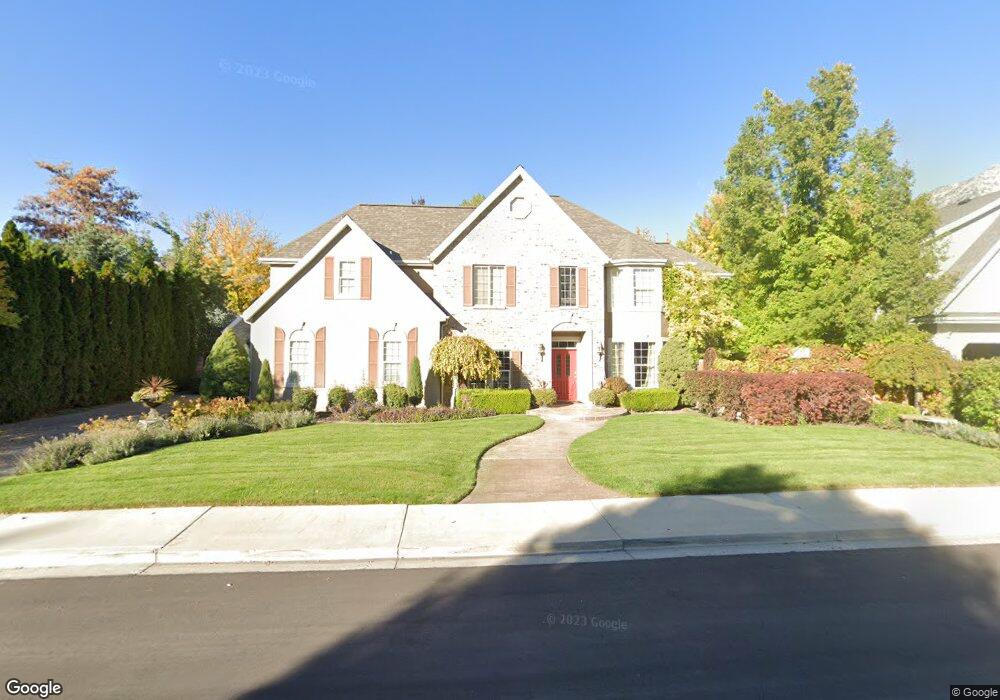
372 W 3800 N Provo, UT 84604
Riverside NeighborhoodEstimated Value: $926,000 - $1,192,000
6
Beds
4
Baths
4,667
Sq Ft
$217/Sq Ft
Est. Value
About This Home
This home is located at 372 W 3800 N, Provo, UT 84604 and is currently estimated at $1,011,103, approximately $216 per square foot. 372 W 3800 N is a home located in Utah County with nearby schools including Canyon Crest Elementary School, Centennial Middle School, and Timpview High School.
Ownership History
Date
Name
Owned For
Owner Type
Purchase Details
Closed on
Jan 31, 2003
Sold by
Engemann Paul and Engemann Suzanne
Bought by
Engemann Paul and Engemann Suzanne Barnes
Current Estimated Value
Home Financials for this Owner
Home Financials are based on the most recent Mortgage that was taken out on this home.
Original Mortgage
$322,700
Outstanding Balance
$136,994
Interest Rate
5.83%
Estimated Equity
$874,109
Purchase Details
Closed on
Feb 24, 2000
Sold by
Engemann Paul
Bought by
Engemann Suzanne
Home Financials for this Owner
Home Financials are based on the most recent Mortgage that was taken out on this home.
Original Mortgage
$68,000
Interest Rate
8.16%
Mortgage Type
Stand Alone Second
Purchase Details
Closed on
Aug 28, 1998
Sold by
Lei Lee and Lei Lily
Bought by
Engemann Paul and Engemann Suzanne Barnes
Home Financials for this Owner
Home Financials are based on the most recent Mortgage that was taken out on this home.
Original Mortgage
$299,625
Interest Rate
6.91%
Create a Home Valuation Report for This Property
The Home Valuation Report is an in-depth analysis detailing your home's value as well as a comparison with similar homes in the area
Home Values in the Area
Average Home Value in this Area
Purchase History
| Date | Buyer | Sale Price | Title Company |
|---|---|---|---|
| Engemann Paul | -- | Titlewriters Inc | |
| Engemann Paul | -- | Titlewriters Inc | |
| Engemann Suzanne | -- | Sundance Title Insurance | |
| Engemann Paul | -- | -- |
Source: Public Records
Mortgage History
| Date | Status | Borrower | Loan Amount |
|---|---|---|---|
| Open | Engemann Paul | $322,700 | |
| Closed | Engemann Suzanne | $68,000 | |
| Closed | Engemann Paul | $299,625 |
Source: Public Records
Tax History Compared to Growth
Tax History
| Year | Tax Paid | Tax Assessment Tax Assessment Total Assessment is a certain percentage of the fair market value that is determined by local assessors to be the total taxable value of land and additions on the property. | Land | Improvement |
|---|---|---|---|---|
| 2025 | $4,692 | $486,860 | $353,500 | $531,700 |
| 2024 | $4,692 | $461,890 | $0 | $0 |
| 2023 | $4,979 | $483,120 | $0 | $0 |
| 2022 | $5,614 | $549,285 | $0 | $0 |
| 2021 | $4,691 | $800,500 | $276,100 | $524,400 |
| 2020 | $4,652 | $744,200 | $230,100 | $514,100 |
| 2019 | $4,473 | $744,200 | $230,100 | $514,100 |
| 2018 | $3,990 | $673,200 | $197,200 | $476,000 |
| 2017 | $3,617 | $335,335 | $0 | $0 |
| 2016 | $2,161 | $186,780 | $0 | $0 |
| 2015 | $2,138 | $186,780 | $0 | $0 |
| 2014 | $1,978 | $180,125 | $0 | $0 |
Source: Public Records
Map
Nearby Homes
- 404 W 3700 N
- 282 W 4020 N
- 455 W 4150 St N
- 3535 N 160 St W
- 3477 Brookside Dr
- 3430 Brookside Dr
- 4246 N Stonecrossing
- 387 S 1000 E
- 812 S 890 E
- 325 S 1000 E
- 3240 Shadowbrook Dr
- 299 E 4000 N
- 350 S 900 E
- 847 E 400 S
- 4161 N Canyon Rd Unit 2
- 3711 N Canyon Rd
- 567 S 670 E
- 153 S 1000 E
- 3057 N 100 W
- 533 S 670 E