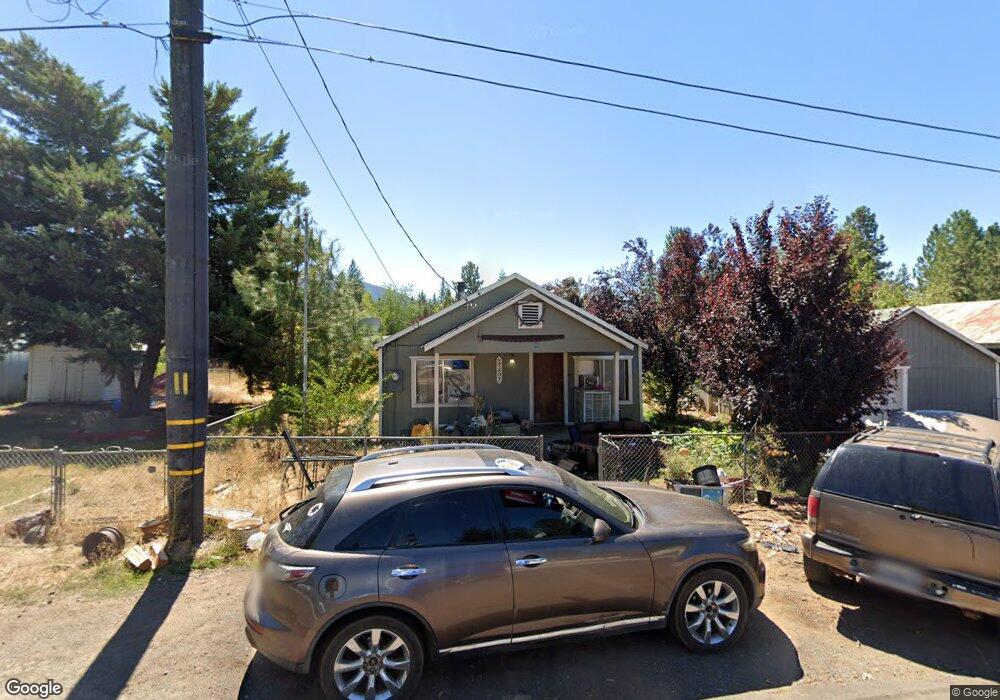
37207 Bue Way Burney, CA 96013
Estimated Value: $160,000 - $196,000
3
Beds
1
Bath
1,152
Sq Ft
$156/Sq Ft
Est. Value
About This Home
This home is located at 37207 Bue Way, Burney, CA 96013 and is currently estimated at $179,719, approximately $156 per square foot. 37207 Bue Way is a home located in Shasta County with nearby schools including Burney Elementary School and Burney Junior/Senior High School.
Ownership History
Date
Name
Owned For
Owner Type
Purchase Details
Closed on
Oct 6, 2023
Sold by
Slavcapital Company Massachusetts Busine
Bought by
Slavcapital Company Massachusetts Business Tr and Kyrylyuk
Current Estimated Value
Home Financials for this Owner
Home Financials are based on the most recent Mortgage that was taken out on this home.
Original Mortgage
$90,000
Outstanding Balance
$87,897
Interest Rate
7.12%
Mortgage Type
New Conventional
Estimated Equity
$91,822
Purchase Details
Closed on
Nov 2, 2022
Sold by
Holdaway Larry
Bought by
Slavcapital Company
Purchase Details
Closed on
Nov 22, 2021
Sold by
Larry Holdaway
Bought by
Holdaway Larry
Home Financials for this Owner
Home Financials are based on the most recent Mortgage that was taken out on this home.
Original Mortgage
$80,000
Interest Rate
3.69%
Mortgage Type
New Conventional
Purchase Details
Closed on
Feb 16, 2016
Sold by
Hamor Billie L and Bolton Karen Sue
Bought by
Holdaway Larry and Derner Cindy
Purchase Details
Closed on
Jul 12, 2004
Sold by
Foster Bill and Foster Margie
Bought by
Hamor Billie L and Foster Karen Sue
Create a Home Valuation Report for This Property
The Home Valuation Report is an in-depth analysis detailing your home's value as well as a comparison with similar homes in the area
Home Values in the Area
Average Home Value in this Area
Purchase History
| Date | Buyer | Sale Price | Title Company |
|---|---|---|---|
| Slavcapital Company Massachusetts Business Tr | -- | None Listed On Document | |
| Slavcapital Company | $89,500 | Stewart Title | |
| Holdaway Larry | -- | New Title Company Name | |
| Holdaway Larry | $83,000 | Placer Title Company | |
| Volbrecht Vivian M | -- | Placer Title Company | |
| Hamor Billie L | -- | Placer Title Company | |
| Hamor Billie L | -- | -- |
Source: Public Records
Mortgage History
| Date | Status | Borrower | Loan Amount |
|---|---|---|---|
| Open | Slavcapital Company Massachusetts Business Tr | $90,000 | |
| Previous Owner | Holdaway Larry | $80,000 | |
| Closed | Holdaway Larry | $0 |
Source: Public Records
Tax History
| Year | Tax Paid | Tax Assessment Tax Assessment Total Assessment is a certain percentage of the fair market value that is determined by local assessors to be the total taxable value of land and additions on the property. | Land | Improvement |
|---|---|---|---|---|
| 2025 | $1,650 | $156,060 | $20,808 | $135,252 |
| 2024 | $1,628 | $153,000 | $20,400 | $132,600 |
| 2023 | $1,628 | $150,000 | $20,000 | $130,000 |
| 2022 | $920 | $92,584 | $22,309 | $70,275 |
| 2021 | $898 | $90,770 | $21,872 | $68,898 |
| 2020 | $894 | $89,840 | $21,648 | $68,192 |
| 2019 | $858 | $88,079 | $21,224 | $66,855 |
| 2018 | $891 | $86,353 | $20,808 | $65,545 |
| 2017 | $844 | $84,660 | $20,400 | $64,260 |
| 2016 | $437 | $40,607 | $9,837 | $30,770 |
| 2015 | $428 | $39,998 | $9,690 | $30,308 |
| 2014 | $423 | $39,216 | $9,501 | $29,715 |
Source: Public Records
Map
Nearby Homes
- 37176 Washburn Ave
- 37269 Birch Ave
- 20344 Hudson St
- 37217 Park Ave
- 37329 Ponderosa Ave
- 37353 & 57 Ponderosa Ave
- 000 Park Ave
- 37176 Superior Ave Unit A&B
- 37061 Park Ave
- 20476 Marquette St
- 37153 Siskiyou St
- 0 Serpentine Ln
- 20194 Sugar Pine St
- 37023 Park Ave
- 20227 Sugar Pine St
- 0 Superior Ave
- 20274 Arrowood St
- 010 Kirby Ct
- 007 Kirby Ct
- 011 Kirby Ct
- 37195 Bue Way
- 37219 Bue Way
- 20300 Grogan St
- 20294 Grogan St
- 37193 Bue Way
- 37208 Bue Way
- 37194 Bue Way
- 37216 Bue Way
- 20322 Grogan St
- 20286 Grogan St
- 37171 Bue Way
- 37196 Sandy Ln
- 20274 Grogan St
- 20297 Grogan St
- 20305 Grogan St
- 20289 Grogan St
- 37247 Birch Ave
- 37212 Birch Ave
- 20283 Grogan St
- 20268 Grogan St
Your Personal Tour Guide
Ask me questions while you tour the home.