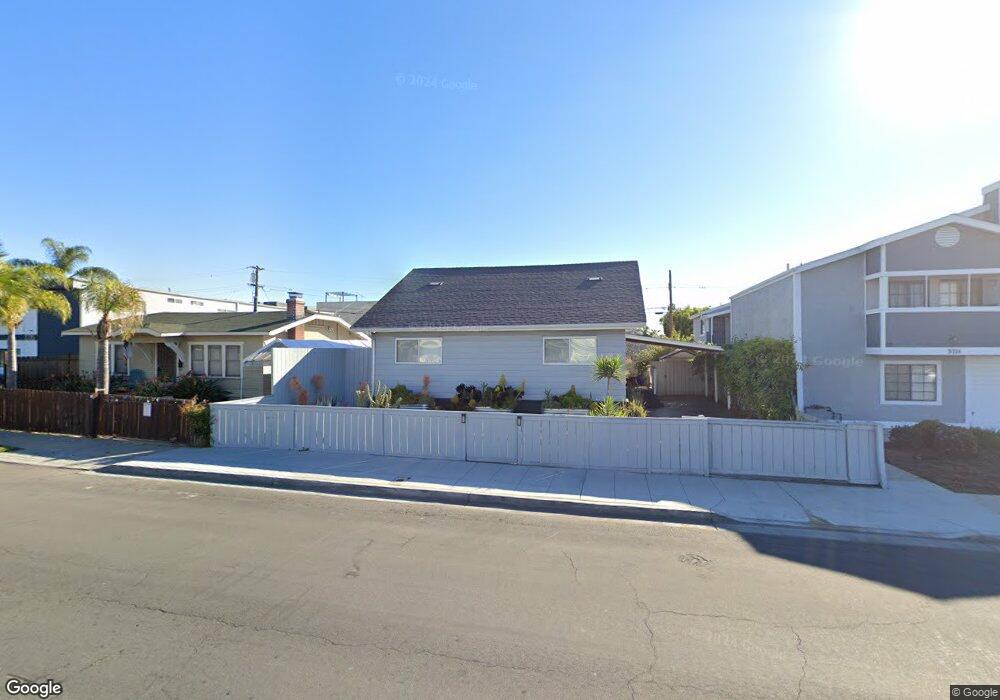
3721 32nd St San Diego, CA 92104
North Park NeighborhoodEstimated Value: $1,216,000 - $1,343,000
3
Beds
2
Baths
1,360
Sq Ft
$941/Sq Ft
Est. Value
About This Home
This home is located at 3721 32nd St, San Diego, CA 92104 and is currently estimated at $1,280,259, approximately $941 per square foot. 3721 32nd St is a home located in San Diego County with nearby schools including McKinley Elementary School, Roosevelt International Middle School, and North Park Christian School.
Ownership History
Date
Name
Owned For
Owner Type
Purchase Details
Closed on
Jul 10, 2020
Sold by
Toft Jonathan Kyle and Toft Jonathan Kyle
Bought by
Toft Jonathan Kyle and Jonathan Kyle Toft Trust
Current Estimated Value
Home Financials for this Owner
Home Financials are based on the most recent Mortgage that was taken out on this home.
Original Mortgage
$399,000
Outstanding Balance
$353,807
Interest Rate
3.1%
Mortgage Type
New Conventional
Estimated Equity
$926,452
Purchase Details
Closed on
Aug 23, 2019
Sold by
Toft Jonathan Kyle
Bought by
Toft Jonathan Kyle and Jonathan Kyle Toft Trust
Purchase Details
Closed on
Apr 16, 2014
Sold by
Pagaling Michael
Bought by
Pagaling Kassandra Claire
Home Financials for this Owner
Home Financials are based on the most recent Mortgage that was taken out on this home.
Original Mortgage
$452,000
Interest Rate
4.38%
Mortgage Type
New Conventional
Purchase Details
Closed on
Apr 14, 2014
Sold by
Pagaling Kassandra Claire and Babin Kassandra C
Bought by
Toft Jonathan Kyle
Home Financials for this Owner
Home Financials are based on the most recent Mortgage that was taken out on this home.
Original Mortgage
$452,000
Interest Rate
4.38%
Mortgage Type
New Conventional
Purchase Details
Closed on
May 22, 2011
Sold by
Shaw Adam G and Shaw Kara Erin Yapak
Bought by
Babin Kassandra C
Home Financials for this Owner
Home Financials are based on the most recent Mortgage that was taken out on this home.
Original Mortgage
$430,000
Interest Rate
4.56%
Mortgage Type
VA
Purchase Details
Closed on
Jan 14, 2009
Sold by
Shaw Adam
Bought by
Shaw Adam G
Home Financials for this Owner
Home Financials are based on the most recent Mortgage that was taken out on this home.
Original Mortgage
$275,000
Interest Rate
5.49%
Mortgage Type
New Conventional
Purchase Details
Closed on
Sep 27, 2002
Sold by
Deleonardo Joseph A
Bought by
Shaw Adam
Home Financials for this Owner
Home Financials are based on the most recent Mortgage that was taken out on this home.
Original Mortgage
$299,500
Interest Rate
6.17%
Purchase Details
Closed on
May 11, 2001
Sold by
Covarrubias Mark A and Covarrubias Salvador
Bought by
Deleonardo Joseph A
Home Financials for this Owner
Home Financials are based on the most recent Mortgage that was taken out on this home.
Original Mortgage
$210,000
Interest Rate
7.25%
Purchase Details
Closed on
Aug 13, 1996
Sold by
Covarrubias Ruth S
Bought by
Covarrubias Salvador and Covarrubias Ruth S
Create a Home Valuation Report for This Property
The Home Valuation Report is an in-depth analysis detailing your home's value as well as a comparison with similar homes in the area
Home Values in the Area
Average Home Value in this Area
Purchase History
| Date | Buyer | Sale Price | Title Company |
|---|---|---|---|
| Toft Jonathan Kyle | -- | Bnt Title Company Of Ca | |
| Toft Jonathan Kyle | -- | None Available | |
| Pagaling Kassandra Claire | -- | Lawyers Title | |
| Toft Jonathan Kyle | $565,000 | Lawyers Title | |
| Babin Kassandra C | $430,000 | Chicago Title Company | |
| Shaw Adam G | -- | Chicago Title Servicelink Di | |
| Shaw Adam | $358,500 | Chicago Title Co | |
| Deleonardo Joseph A | $262,500 | Equity Title Company | |
| Covarrubias Salvador | -- | -- |
Source: Public Records
Mortgage History
| Date | Status | Borrower | Loan Amount |
|---|---|---|---|
| Open | Toft Jonathan Kyle | $399,000 | |
| Closed | Toft Jonathan Kyle | $452,000 | |
| Previous Owner | Babin Kassandra C | $430,000 | |
| Previous Owner | Shaw Adam G | $275,000 | |
| Previous Owner | Shaw Adam | $299,500 | |
| Previous Owner | Deleonardo Joseph A | $210,000 | |
| Closed | Deleonardo Joseph A | $52,500 |
Source: Public Records
Tax History Compared to Growth
Tax History
| Year | Tax Paid | Tax Assessment Tax Assessment Total Assessment is a certain percentage of the fair market value that is determined by local assessors to be the total taxable value of land and additions on the property. | Land | Improvement |
|---|---|---|---|---|
| 2025 | $8,512 | $708,530 | $487,754 | $220,776 |
| 2024 | $8,512 | $694,639 | $478,191 | $216,448 |
| 2023 | $8,321 | $681,019 | $468,815 | $212,204 |
| 2022 | $8,097 | $667,667 | $459,623 | $208,044 |
| 2021 | $8,039 | $654,576 | $450,611 | $203,965 |
| 2020 | $7,941 | $647,865 | $445,991 | $201,874 |
| 2019 | $7,797 | $635,163 | $437,247 | $197,916 |
| 2018 | $7,125 | $608,710 | $428,674 | $180,036 |
| 2017 | $6,954 | $596,775 | $420,269 | $176,506 |
| 2016 | $6,842 | $585,075 | $412,029 | $173,046 |
| 2015 | $6,739 | $576,287 | $405,840 | $170,447 |
| 2014 | $5,269 | $449,400 | $316,482 | $132,918 |
Source: Public Records
Map
Nearby Homes
- 3780 32nd St
- 0 Boundary St Unit SB25155904
- 3077 Landis St
- 3257 Dwight St
- 3509-11 32nd St
- 3544 Boundary St
- 3455 Landis St
- 3705 Swift Ave
- 3950 Ohio St Unit 507
- 3344 Upas St
- 3365 Grim Ave
- 3864 35th St
- 3365-69 Grim Ave
- 2842 Gunn St
- 3376 30th St
- 0 35th St
- 3653 Wilson Ave
- 4048-50 35th St
- 3322 Nile St
- 3421 Vancouver Ave
- 3729/3731 32nd
- 3731 32nd St
- 3729 32nd St
- 3711 32nd St
- 3214 Landis St
- 3705 32nd St
- 3735 32nd St Unit 8
- 3724 Bancroft St
- 3714 Bancroft St
- 3224 Landis St
- 3724 32nd St
- 3730 Bancroft St
- 3747 32nd St
- 3747 32nd St Unit 3
- 3747 32nd St Unit 9
- 3747 32nd St Unit 8
- 3747 32nd St Unit 7
- 3747 32nd St Unit 6
- 3747 32nd St Unit 5
- 3747 32nd St Unit 4