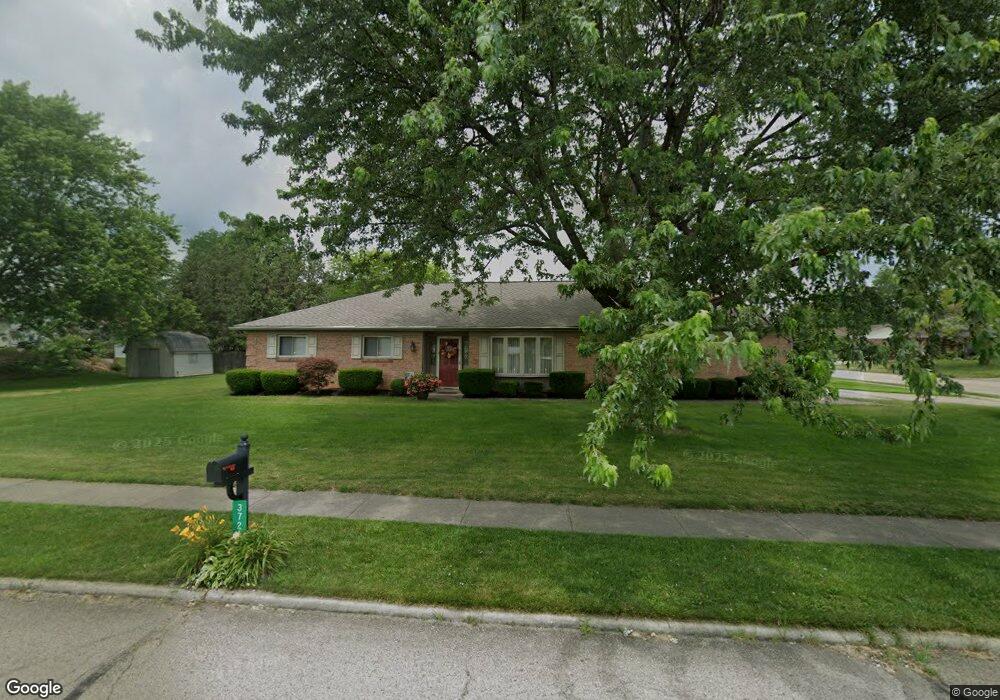
3721 Dawnridge Dr Dayton, OH 45414
Estimated Value: $285,000 - $321,000
3
Beds
2
Baths
2,165
Sq Ft
$138/Sq Ft
Est. Value
About This Home
This home is located at 3721 Dawnridge Dr, Dayton, OH 45414 and is currently estimated at $299,546, approximately $138 per square foot. 3721 Dawnridge Dr is a home located in Montgomery County with nearby schools including Demmitt Elementary School, Smith Middle School, and Butler High School.
Ownership History
Date
Name
Owned For
Owner Type
Purchase Details
Closed on
Nov 26, 2021
Sold by
Henson Steven and Janice M Allen Revocable Trust
Bought by
Becker Beth E
Current Estimated Value
Home Financials for this Owner
Home Financials are based on the most recent Mortgage that was taken out on this home.
Original Mortgage
$221,350
Interest Rate
2.98%
Mortgage Type
New Conventional
Purchase Details
Closed on
Dec 11, 2017
Sold by
Allen Janice M
Bought by
Allen Janice M and The Janice M Allen Revocable Trust
Purchase Details
Closed on
Oct 25, 2017
Sold by
Allen Janice M
Bought by
Allen Janice M
Purchase Details
Closed on
May 8, 2009
Sold by
Janice M Allen Revocable Trust and Henson Steven
Bought by
Becker Beth E
Home Financials for this Owner
Home Financials are based on the most recent Mortgage that was taken out on this home.
Original Mortgage
$221,350
Interest Rate
2.98%
Mortgage Type
New Conventional
Create a Home Valuation Report for This Property
The Home Valuation Report is an in-depth analysis detailing your home's value as well as a comparison with similar homes in the area
Home Values in the Area
Average Home Value in this Area
Purchase History
| Date | Buyer | Sale Price | Title Company |
|---|---|---|---|
| Becker Beth E | $233,000 | Landmark Ttl Agcy South Inc | |
| Allen Janice M | -- | None Available | |
| Allen Janice M | -- | None Available | |
| Becker Beth E | -- | Landmark Title | |
| Allen Janice M | -- | Attorney | |
| Allen Carl J | -- | None Available | |
| Allen Carl J | -- | None Available |
Source: Public Records
Mortgage History
| Date | Status | Borrower | Loan Amount |
|---|---|---|---|
| Previous Owner | Becker Beth E | $221,350 | |
| Previous Owner | Becker Beth E | $221,350 |
Source: Public Records
Tax History Compared to Growth
Tax History
| Year | Tax Paid | Tax Assessment Tax Assessment Total Assessment is a certain percentage of the fair market value that is determined by local assessors to be the total taxable value of land and additions on the property. | Land | Improvement |
|---|---|---|---|---|
| 2024 | $4,678 | $75,950 | $19,620 | $56,330 |
| 2023 | $4,678 | $75,950 | $19,620 | $56,330 |
| 2022 | $4,136 | $53,490 | $13,820 | $39,670 |
| 2021 | $3,464 | $53,490 | $13,820 | $39,670 |
| 2020 | $3,455 | $53,490 | $13,820 | $39,670 |
| 2019 | $3,286 | $47,540 | $13,820 | $33,720 |
| 2018 | $3,292 | $47,540 | $13,820 | $33,720 |
| 2017 | $3,270 | $47,540 | $13,820 | $33,720 |
| 2016 | $3,270 | $46,810 | $13,820 | $32,990 |
| 2015 | $3,100 | $46,810 | $13,820 | $32,990 |
| 2014 | $3,100 | $46,810 | $13,820 | $32,990 |
| 2012 | -- | $48,480 | $13,630 | $34,850 |
Source: Public Records
Map
Nearby Homes
- 7227 Gardenside Dr
- 7184 Brantford Rd
- 7475 Brantford Rd
- 7420 New York Way
- 7612 Turtleback Dr
- 3166 Little York Rd
- 7019 Brantford Rd
- Bellamy Plan at Yorkshire Reserve - The Oaks at Yorkshire Reserve
- Newcastle Plan at Yorkshire Reserve - The Oaks at Yorkshire Reserve
- Chatham Plan at Yorkshire Reserve - The Oaks at Yorkshire Reserve
- Holcombe Plan at Yorkshire Reserve - The Oaks at Yorkshire Reserve
- Milford Plan at Yorkshire Reserve - The Oaks at Yorkshire Reserve
- Johnstown Plan at Yorkshire Reserve - The Oaks at Yorkshire Reserve
- 7562 Yorkshire Dr
- 7568 Yorkshire Dr
- 6810 Trailview Dr
- 3114 Northerton Ct
- 7052 Society Ct
- 7042 Society Ct
- 6501 Woodville Dr
- 7539 Gardenside Dr
- 7400 Larissa Ct
- 7431 Gardenside Dr
- 7549 Gardenside Dr
- 7410 Larissa Ct
- 7530 Gardenside Dr
- 3710 Dawnridge Dr
- 7438 Gardenside Dr
- 7540 Gardenside Dr
- 7559 Gardenside Dr
- 7421 Gardenside Dr
- 7420 Larissa Ct
- 7428 Gardenside Dr
- 3700 Dawnridge Dr
- 7550 Gardenside Dr
- 3621 Dawnridge Dr
- 7569 Gardenside Dr
- 7401 Roselake Dr
- 7531 Glenhurst Dr
- 7521 Glenhurst Dr