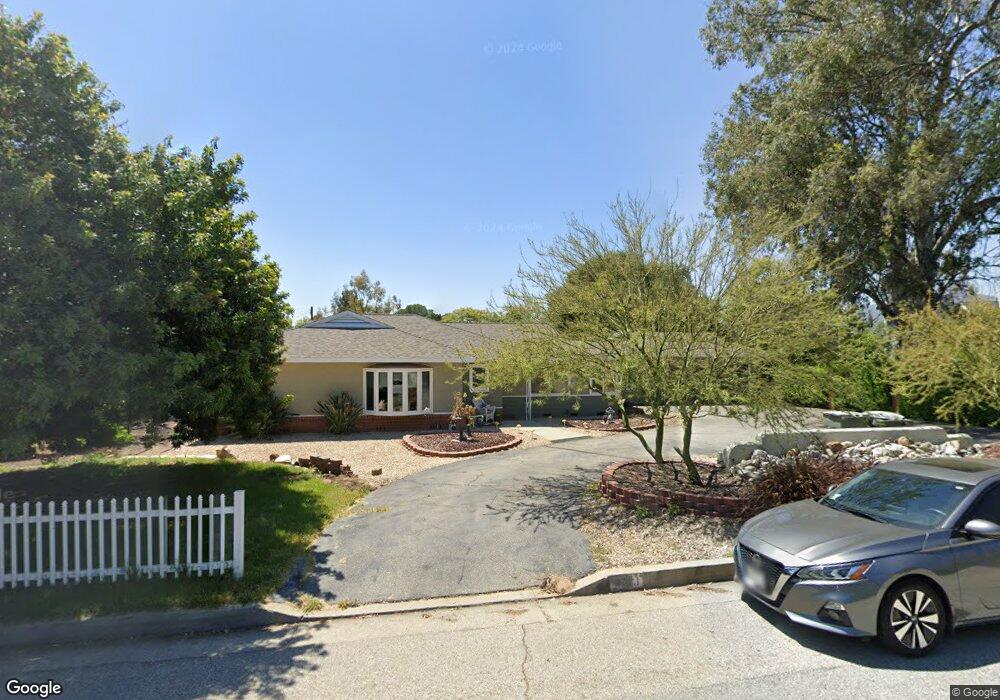
3721 Garey Ave La Verne, CA 91750
Pomona Valley NeighborhoodEstimated Value: $991,683 - $1,184,000
3
Beds
2
Baths
2,334
Sq Ft
$467/Sq Ft
Est. Value
About This Home
This home is located at 3721 Garey Ave, La Verne, CA 91750 and is currently estimated at $1,090,171, approximately $467 per square foot. 3721 Garey Ave is a home located in Los Angeles County with nearby schools including Sumner Elementary School, El Roble Intermediate School, and Claremont High School.
Ownership History
Date
Name
Owned For
Owner Type
Purchase Details
Closed on
Nov 9, 2012
Sold by
Radke Jon C
Bought by
Radke Jon C and Radke Nancy J
Current Estimated Value
Purchase Details
Closed on
Jun 30, 2000
Sold by
U S Bank Trust National Assn
Bought by
Radke Jon and Radke Nancy
Home Financials for this Owner
Home Financials are based on the most recent Mortgage that was taken out on this home.
Original Mortgage
$156,000
Outstanding Balance
$55,387
Interest Rate
8.12%
Estimated Equity
$1,034,784
Purchase Details
Closed on
Feb 24, 2000
Sold by
Lawrence Steven C
Bought by
New Century Home Equity Loan Tr Series 1
Purchase Details
Closed on
May 4, 1999
Sold by
Lawrence Steven C
Bought by
Lawrence Steven C
Home Financials for this Owner
Home Financials are based on the most recent Mortgage that was taken out on this home.
Original Mortgage
$184,800
Interest Rate
10.8%
Create a Home Valuation Report for This Property
The Home Valuation Report is an in-depth analysis detailing your home's value as well as a comparison with similar homes in the area
Home Values in the Area
Average Home Value in this Area
Purchase History
| Date | Buyer | Sale Price | Title Company |
|---|---|---|---|
| Radke Jon C | -- | None Available | |
| Radke Jon C | -- | None Available | |
| Radke Jon | $195,000 | American Title | |
| New Century Home Equity Loan Tr Series 1 | $201,671 | -- | |
| Lawrence Steven C | -- | Orange Coast Title |
Source: Public Records
Mortgage History
| Date | Status | Borrower | Loan Amount |
|---|---|---|---|
| Open | Radke Jon | $156,000 | |
| Previous Owner | Lawrence Steven C | $184,800 |
Source: Public Records
Tax History Compared to Growth
Tax History
| Year | Tax Paid | Tax Assessment Tax Assessment Total Assessment is a certain percentage of the fair market value that is determined by local assessors to be the total taxable value of land and additions on the property. | Land | Improvement |
|---|---|---|---|---|
| 2025 | $5,248 | $435,453 | $284,780 | $150,673 |
| 2024 | $5,248 | $426,916 | $279,197 | $147,719 |
| 2023 | $5,144 | $418,546 | $273,723 | $144,823 |
| 2022 | $5,059 | $410,340 | $268,356 | $141,984 |
| 2021 | $4,978 | $402,295 | $263,095 | $139,200 |
| 2019 | $4,754 | $390,365 | $255,293 | $135,072 |
| 2018 | $4,527 | $382,712 | $250,288 | $132,424 |
| 2016 | $4,213 | $367,853 | $240,570 | $127,283 |
| 2015 | $4,142 | $362,329 | $236,957 | $125,372 |
| 2014 | $4,116 | $355,233 | $232,316 | $122,917 |
Source: Public Records
Map
Nearby Homes
- 175 Arlington Dr
- 3284 Dawnview Ave
- 301 E Foothill Blvd Unit 63
- 301 E Foothill Blvd Unit 34
- 301 E Foothill Blvd Unit 24
- 301 E Foothill Blvd
- 301 E Foothill Blvd Unit 80
- 301 E Foothill Blvd Unit 58
- 301 E Foothill Blvd Unit 59
- 1359 Cedarview Dr
- 222 E Foothill Blvd
- 497 Fort Lewis Dr
- 327 Flaxton St
- 3252 Florinda St
- 3800 Bradford St Unit 233
- 3800 Bradford St Unit 47
- 3800 Bradford St Unit 138
- 3800 Bradford St Unit 85
- 3800 Bradford St Unit 57
- 3800 Bradford St Unit 188
- 105 Serrano Place
- 3736 Garey Ave
- 3716 Live Oak Dr
- 111 Serrano Place
- 3720 Live Oak Dr
- 3712 Live Oak Dr
- 3724 Live Oak Dr
- 3728 Live Oak Dr
- 3742 Garey Ave
- 3708 Live Oak Dr
- 3732 Live Oak Dr
- 3704 Live Oak Dr
- 3718 Garey Ave
- 121 Serrano Place
- 3710 Garey Ave
- 3744 Live Oak Dr
- 122 Serrano Place
- 120 Serrano Place
- 3704 Garey Ave
- 120 Scarlet Oak Cir