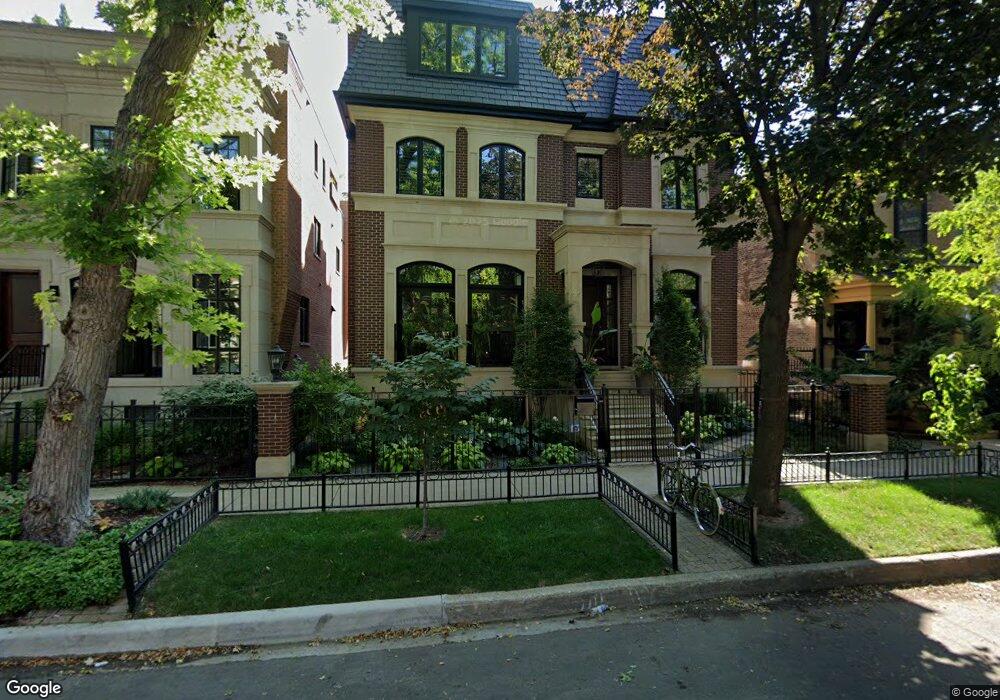
3721 N Greenview Ave Chicago, IL 60613
Southport Corridor NeighborhoodEstimated Value: $2,940,000 - $4,725,000
6
Beds
8
Baths
6,981
Sq Ft
$556/Sq Ft
Est. Value
About This Home
This home is located at 3721 N Greenview Ave, Chicago, IL 60613 and is currently estimated at $3,880,410, approximately $555 per square foot. 3721 N Greenview Ave is a home located in Cook County with nearby schools including Blaine Elementary School, Lake View High School, and Saint Andrew School.
Ownership History
Date
Name
Owned For
Owner Type
Purchase Details
Closed on
Dec 8, 2014
Sold by
Prokup Steven J and Jin Chaoran
Bought by
Marianne Byrne Eamonn and Shea Marianne O
Current Estimated Value
Home Financials for this Owner
Home Financials are based on the most recent Mortgage that was taken out on this home.
Original Mortgage
$1,031,250
Interest Rate
3.25%
Mortgage Type
Commercial
Purchase Details
Closed on
May 7, 2004
Sold by
Lasalle Bank Na
Bought by
Prokup Steven J and Jin Chaoran
Home Financials for this Owner
Home Financials are based on the most recent Mortgage that was taken out on this home.
Original Mortgage
$750,000
Interest Rate
5.37%
Mortgage Type
Commercial
Purchase Details
Closed on
Sep 27, 1993
Sold by
Ahrens William R and Chung Youngran
Bought by
American National Bk & Tr Co Of Chicago and Trust #64964
Create a Home Valuation Report for This Property
The Home Valuation Report is an in-depth analysis detailing your home's value as well as a comparison with similar homes in the area
Home Values in the Area
Average Home Value in this Area
Purchase History
| Date | Buyer | Sale Price | Title Company |
|---|---|---|---|
| Marianne Byrne Eamonn | $1,395,000 | Proper Title Llc | |
| Prokup Steven J | $1,156,500 | Atgf Inc | |
| American National Bk & Tr Co Of Chicago | -- | -- |
Source: Public Records
Mortgage History
| Date | Status | Borrower | Loan Amount |
|---|---|---|---|
| Closed | Marianne Byrne Eamonn | $1,031,250 | |
| Previous Owner | Prokup Steven J | $750,000 | |
| Closed | Prokup Steven J | $290,000 |
Source: Public Records
Tax History Compared to Growth
Tax History
| Year | Tax Paid | Tax Assessment Tax Assessment Total Assessment is a certain percentage of the fair market value that is determined by local assessors to be the total taxable value of land and additions on the property. | Land | Improvement |
|---|---|---|---|---|
| 2024 | $65,035 | $361,000 | $100,663 | $260,337 |
| 2023 | $63,377 | $311,554 | $81,180 | $230,374 |
| 2022 | $63,377 | $311,554 | $81,180 | $230,374 |
| 2021 | $61,981 | $311,553 | $81,180 | $230,373 |
| 2020 | $68,258 | $309,511 | $34,636 | $274,875 |
| 2019 | $66,903 | $336,425 | $34,636 | $301,789 |
| 2018 | $65,777 | $336,425 | $34,636 | $301,789 |
| 2017 | $63,595 | $298,796 | $30,307 | $268,489 |
| 2016 | $58,455 | $293,472 | $30,307 | $263,165 |
| 2015 | $17,442 | $95,184 | $30,307 | $64,877 |
| 2014 | $14,904 | $82,899 | $24,895 | $58,004 |
| 2013 | $14,599 | $82,899 | $24,895 | $58,004 |
Source: Public Records
Map
Nearby Homes
- 3639 N Greenview Ave
- 3708 N Southport Ave Unit 3
- 3732 N Janssen Ave Unit A
- 3735 N Greenview Ave
- 3719 N Bosworth Ave
- 3752 N Janssen Ave
- 3644 N Bosworth Ave
- 3539 N Southport Ave Unit 2N
- 3760 N Wayne Ave
- 7635 1/2 N Greenview Ave Unit 1S
- 3527 N Bosworth Ave
- 3814 N Greenview Ave Unit 1
- 3509 N Janssen Ave
- 3507 N Bosworth Ave
- 3555 N Marshfield Ave Unit 1
- 3806 N Ashland Ave Unit 3N
- 3853 N Janssen Ave
- 3835 N Ashland Ave Unit 1N
- 3719 N Magnolia Ave
- 3434 N Southport Ave Unit 2
- 3721 N Greenview Ave
- 3715 N Greenview Ave
- 3723 N Greenview Ave
- 3723 N Greenview Ave
- 3727 N Greenview Ave
- 3713 N Greenview Ave
- 3729 N Greenview Ave
- 3711 N Greenview Ave
- 3711 N Greenview Ave Unit 1
- 3711 N Greenview Ave
- 3731 N Greenview Ave
- 3709 N Greenview Ave
- 3733 N Greenview Ave
- 3733 N Greenview Ave Unit 3
- 3733 N Greenview Ave Unit 2
- 3733 N Greenview Ave
- 3733 N Greenview Ave Unit 1
- 3720 N Janssen Ave
- 3720 N Janssen Ave
- 3707 N Greenview Ave