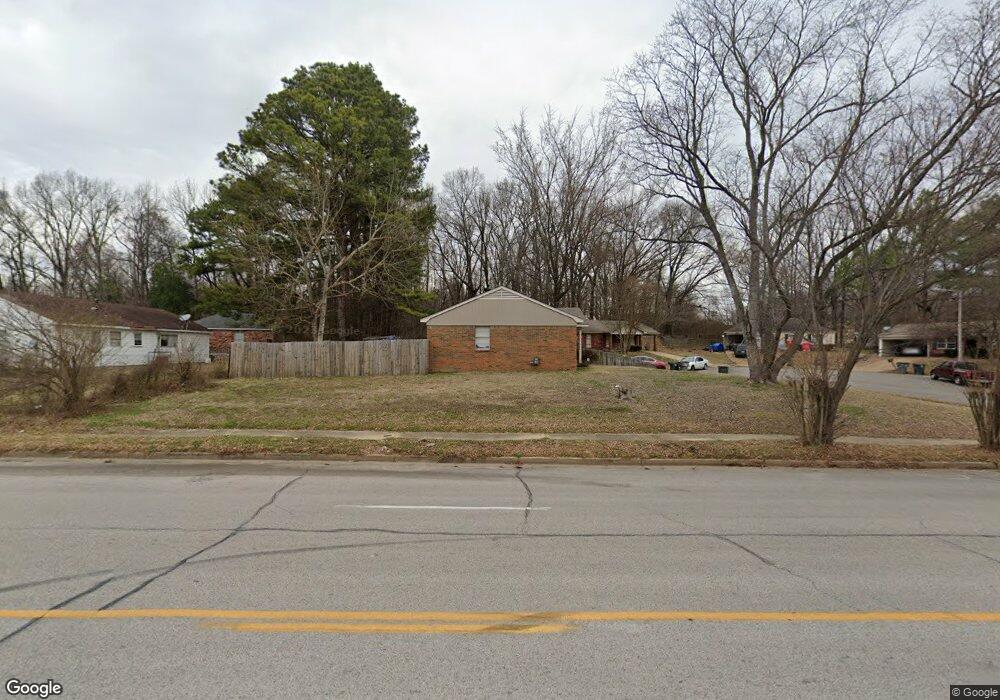
3722 Ridgemont Rd Memphis, TN 38128
Raleigh NeighborhoodEstimated Value: $103,000 - $107,704
3
Beds
1
Bath
910
Sq Ft
$117/Sq Ft
Est. Value
About This Home
This home is located at 3722 Ridgemont Rd, Memphis, TN 38128 and is currently estimated at $106,176, approximately $116 per square foot. 3722 Ridgemont Rd is a home located in Shelby County with nearby schools including Egypt Elementary School, Raleigh Egypt High School, and Promise Academy - Spring Hill.
Ownership History
Date
Name
Owned For
Owner Type
Purchase Details
Closed on
Jun 18, 2021
Sold by
Rbs Properties Llc
Bought by
Moore Byron David
Current Estimated Value
Home Financials for this Owner
Home Financials are based on the most recent Mortgage that was taken out on this home.
Original Mortgage
$107,415
Outstanding Balance
$97,251
Interest Rate
2.9%
Mortgage Type
VA
Estimated Equity
$8,925
Purchase Details
Closed on
Mar 30, 2021
Sold by
Akenobo Llc
Bought by
Rbs Properties Llc
Home Financials for this Owner
Home Financials are based on the most recent Mortgage that was taken out on this home.
Original Mortgage
$79,900
Interest Rate
3%
Mortgage Type
Purchase Money Mortgage
Purchase Details
Closed on
Apr 27, 2011
Sold by
Memphis Invest Gp
Bought by
Akenobo Llc
Purchase Details
Closed on
Jul 28, 2010
Sold by
Pritchard Thelma Y
Bought by
Secretary Of Housing & Urban Development
Purchase Details
Closed on
May 31, 1995
Bought by
Pritchard Thelma Y
Create a Home Valuation Report for This Property
The Home Valuation Report is an in-depth analysis detailing your home's value as well as a comparison with similar homes in the area
Home Values in the Area
Average Home Value in this Area
Purchase History
| Date | Buyer | Sale Price | Title Company |
|---|---|---|---|
| Moore Byron David | $105,000 | None Available | |
| Rbs Properties Llc | $64,900 | Closetrak Llc | |
| Akenobo Llc | $54,900 | None Available | |
| Secretary Of Housing & Urban Development | $35,386 | None Available | |
| Pritchard Thelma Y | $42,000 | -- |
Source: Public Records
Mortgage History
| Date | Status | Borrower | Loan Amount |
|---|---|---|---|
| Open | Moore Byron David | $107,415 | |
| Previous Owner | Rbs Properties Llc | $79,900 |
Source: Public Records
Tax History Compared to Growth
Tax History
| Year | Tax Paid | Tax Assessment Tax Assessment Total Assessment is a certain percentage of the fair market value that is determined by local assessors to be the total taxable value of land and additions on the property. | Land | Improvement |
|---|---|---|---|---|
| 2025 | $525 | $24,875 | $2,875 | $22,000 |
| 2024 | $525 | $15,475 | $2,250 | $13,225 |
| 2023 | $943 | $15,475 | $2,250 | $13,225 |
| 2022 | $943 | $15,475 | $2,250 | $13,225 |
| 2021 | $954 | $15,475 | $2,250 | $13,225 |
| 2020 | $980 | $13,525 | $2,250 | $11,275 |
| 2019 | $432 | $13,525 | $2,250 | $11,275 |
| 2018 | $432 | $13,525 | $2,250 | $11,275 |
| 2017 | $442 | $13,525 | $2,250 | $11,275 |
| 2016 | $372 | $10,950 | $0 | $0 |
| 2014 | $479 | $10,950 | $0 | $0 |
Source: Public Records
Map
Nearby Homes
- 3704 Ridgemont Ave
- 4250 Trudy St
- 3614 Trudy Cove
- 4188 Time St
- 3793 Tessland Rd
- 4100 Hitchcock Dr
- 4378 Shadcrest Rd
- 4060 Hitchcock Dr
- 4058 Sandburg St
- 4135 Kerwin Dr
- 4040 Windermere Rd
- 1 Hobson Rd
- 3875 Wordsworth Ave
- 4071 Kerwin Dr
- 3401 Bradcrest Dr
- 3358 Brockcrest Cove
- 4479 Raleigh Millington Rd
- 4657 Christyshire Dr
- 3621 Royal Wood Dr
- 3726 Royal Wood Dr
- 3722 Ridgemont Ave
- 3726 Ridgemont Ave
- 3716 Ridgemont Rd
- 3716 Ridgemont Ave
- 3712 Ridgemont Rd
- 3712 Ridgemont Ave
- 3730 Ridgemont Ave
- 3742 Ridgemont Ave
- 3721 Ridgemont Ave
- 3729 Ridgemont Ave
- 3711 Ridgemont Ave
- 3729 Ridgemont Rd
- 3738 Ridgemont Ave
- 3734 Ridgemont Ave
- 3708 Ridgemont Rd
- 3708 Ridgemont Ave
- 3735 Ridgemont Ave
- 3696 Ridgemont Rd
- 3696 Ridgemont Ave
- 3741 Ridgemont Ave