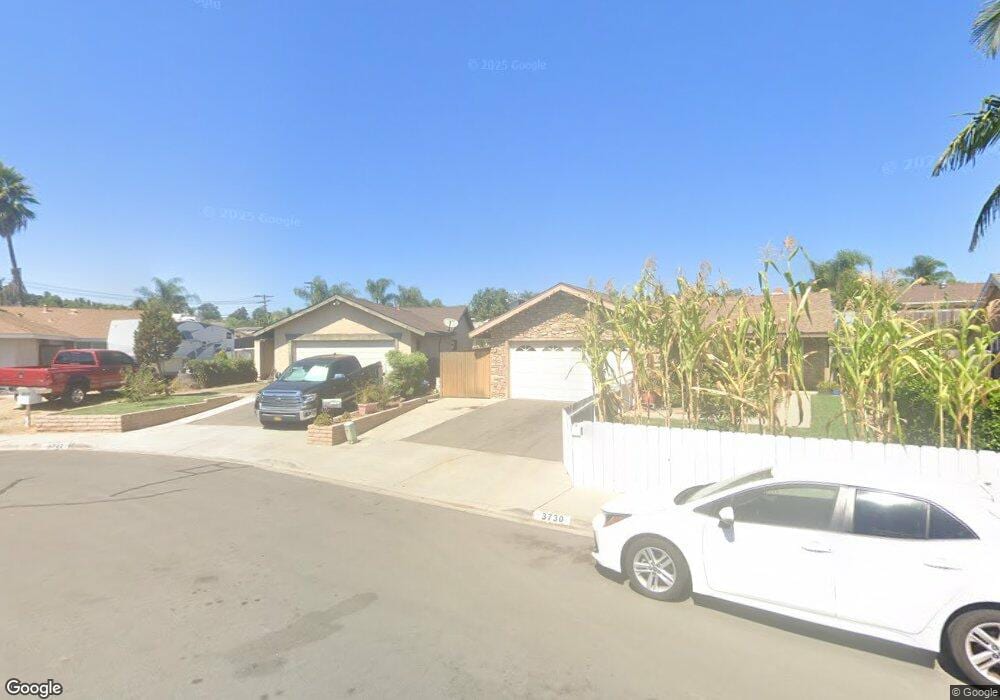
3722 Via de Anza San Marcos, CA 92078
Palomar Estates NeighborhoodEstimated Value: $709,255 - $852,000
3
Beds
1
Bath
1,206
Sq Ft
$651/Sq Ft
Est. Value
About This Home
This home is located at 3722 Via de Anza, San Marcos, CA 92078 and is currently estimated at $784,814, approximately $650 per square foot. 3722 Via de Anza is a home located in San Diego County with nearby schools including La Mirada Academy, San Marcos Middle School, and San Marcos High School.
Ownership History
Date
Name
Owned For
Owner Type
Purchase Details
Closed on
Sep 12, 2018
Sold by
Sanchez Carmen
Bought by
Sanchez Palemon and Sanchez Carmen
Current Estimated Value
Home Financials for this Owner
Home Financials are based on the most recent Mortgage that was taken out on this home.
Original Mortgage
$137,826
Outstanding Balance
$84,870
Interest Rate
4.5%
Mortgage Type
New Conventional
Estimated Equity
$699,944
Purchase Details
Closed on
Feb 10, 2009
Sold by
Sanchez Palemon
Bought by
Sanchez Carmen
Purchase Details
Closed on
Oct 5, 1998
Sold by
Truchard Family Trust 09-02-94 and Liam Martin
Bought by
Sanchez Palemon and Sanchez Carmen
Home Financials for this Owner
Home Financials are based on the most recent Mortgage that was taken out on this home.
Original Mortgage
$137,066
Interest Rate
6.6%
Mortgage Type
FHA
Purchase Details
Closed on
Sep 2, 1994
Sold by
Truchard Liam M and Truchard Suzanne D
Bought by
Truchard Liam Martin and Truchard Suzanne Denise
Purchase Details
Closed on
Aug 20, 1992
Purchase Details
Closed on
Apr 1, 1985
Create a Home Valuation Report for This Property
The Home Valuation Report is an in-depth analysis detailing your home's value as well as a comparison with similar homes in the area
Home Values in the Area
Average Home Value in this Area
Purchase History
| Date | Buyer | Sale Price | Title Company |
|---|---|---|---|
| Sanchez Palemon | -- | Amrock | |
| Sanchez Carmen | -- | None Available | |
| Sanchez Palemon | $139,000 | Chicago Title | |
| Truchard Liam Martin | -- | -- | |
| -- | $134,700 | -- | |
| -- | $74,500 | -- |
Source: Public Records
Mortgage History
| Date | Status | Borrower | Loan Amount |
|---|---|---|---|
| Open | Sanchez Palemon | $137,826 | |
| Closed | Sanchez Palemon | $137,066 |
Source: Public Records
Tax History Compared to Growth
Tax History
| Year | Tax Paid | Tax Assessment Tax Assessment Total Assessment is a certain percentage of the fair market value that is determined by local assessors to be the total taxable value of land and additions on the property. | Land | Improvement |
|---|---|---|---|---|
| 2025 | $2,393 | $217,884 | $136,182 | $81,702 |
| 2024 | $2,393 | $213,612 | $133,512 | $80,100 |
| 2023 | $2,348 | $209,425 | $130,895 | $78,530 |
| 2022 | $2,316 | $205,320 | $128,329 | $76,991 |
| 2021 | $2,278 | $201,295 | $125,813 | $75,482 |
| 2020 | $2,256 | $199,232 | $124,523 | $74,709 |
| 2019 | $2,232 | $195,327 | $122,082 | $73,245 |
| 2018 | $2,161 | $191,498 | $119,689 | $71,809 |
| 2017 | $132 | $187,744 | $117,343 | $70,401 |
| 2016 | $2,086 | $184,064 | $115,043 | $69,021 |
| 2015 | $2,056 | $181,300 | $113,315 | $67,985 |
| 2014 | $2,009 | $177,750 | $111,096 | $66,654 |
Source: Public Records
Map
Nearby Homes
- 3504 Grand Ave
- 0 La Mirada Dr
- 427 Ponte Ave
- 150 S Rancho Santa fe Rd Unit SPC 38
- 3535 Linda Vista Dr Unit 213
- 3535 Linda Vista Dr Unit SPC 153
- 3535 Linda Vista Dr Unit SPC 255
- 3535 Linda Vista Dr Unit 188
- 3535 Linda Vista Dr Unit 332
- 3535 Linda Vista Dr Unit 176
- 3535 Linda Vista Dr Unit 321
- 3535 Linda Vista Dr Unit 193
- 3535 Linda Vista Dr Unit 12
- 3535 Linda Vista Dr Unit 29
- 3535 Linda Vista Dr Unit 298
- 3535 Linda Vista Dr Unit 58
- 3535 Linda Vista Dr Unit 333
- 3355 Descanso Ave
- 1930 W San Marcos Blvd Unit 79
- 1930 W San Marcos Blvd Unit 292
- 3714 Via de Anza
- 3730 Via de Anza
- 3625 La Mirada Dr
- 3619 La Mirada Dr
- 3633 La Mirada Dr
- 3738 Via de Anza
- 3713 Via de Anza
- 3639 La Mirada Dr
- 624 Las Flores Dr
- 608 Las Flores Dr
- 3746 Via de Anza
- 3721 Via de Anza
- 3647 La Mirada Dr
- 3729 Via de Anza
- 3737 Via de Anza
- 3632 La Mirada Dr
- 3754 Via de Anza
- 3626 La Mirada Dr
- 638 Las Flores Dr
- 3638 La Mirada Dr