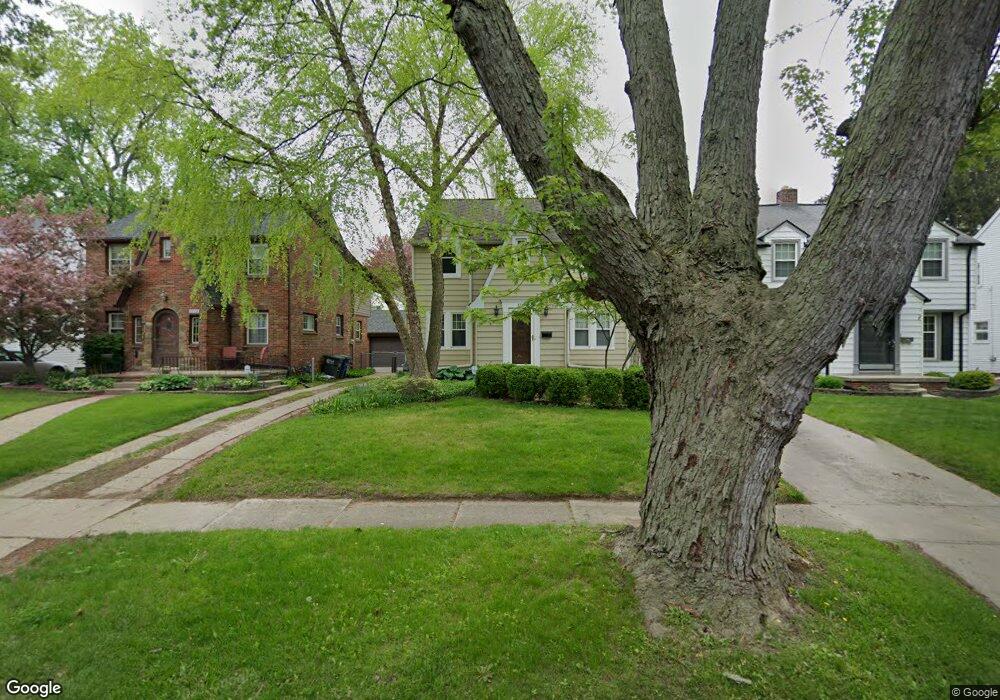
3723 Bowen Rd Toledo, OH 43613
DeVeaux NeighborhoodEstimated Value: $174,000 - $186,000
3
Beds
2
Baths
1,384
Sq Ft
$129/Sq Ft
Est. Value
About This Home
This home is located at 3723 Bowen Rd, Toledo, OH 43613 and is currently estimated at $178,808, approximately $129 per square foot. 3723 Bowen Rd is a home located in Lucas County with nearby schools including Elmhurst Elementary School, Start High School, and Hope Learning Academy of Toledo.
Ownership History
Date
Name
Owned For
Owner Type
Purchase Details
Closed on
Jun 30, 2016
Sold by
Niedzielski Michael J
Bought by
Rickabaugh Rebecca L and Niedzielski Rebecca L
Current Estimated Value
Purchase Details
Closed on
May 29, 2002
Sold by
Carson Shawn M
Bought by
Niedzielski Michael J and Collino Rebecca L
Home Financials for this Owner
Home Financials are based on the most recent Mortgage that was taken out on this home.
Original Mortgage
$102,400
Interest Rate
6.95%
Purchase Details
Closed on
Sep 30, 1999
Sold by
Suter Timothy J and Suter Paula C
Bought by
Carson Shawn M and Carson Lynn
Home Financials for this Owner
Home Financials are based on the most recent Mortgage that was taken out on this home.
Original Mortgage
$99,750
Interest Rate
7.5%
Purchase Details
Closed on
Jan 22, 1992
Sold by
Schafer David J
Purchase Details
Closed on
Jul 12, 1990
Sold by
Schafer Raymond B
Create a Home Valuation Report for This Property
The Home Valuation Report is an in-depth analysis detailing your home's value as well as a comparison with similar homes in the area
Home Values in the Area
Average Home Value in this Area
Purchase History
| Date | Buyer | Sale Price | Title Company |
|---|---|---|---|
| Rickabaugh Rebecca L | -- | None Available | |
| Niedzielski Michael J | $128,000 | Northwest Title Agency Of Oh | |
| Carson Shawn M | $105,000 | Northwest Title Agency Of Oh | |
| -- | $66,000 | -- | |
| -- | -- | -- |
Source: Public Records
Mortgage History
| Date | Status | Borrower | Loan Amount |
|---|---|---|---|
| Previous Owner | Niedzielski Michael J | $102,400 | |
| Previous Owner | Carson Shawn M | $99,750 |
Source: Public Records
Tax History Compared to Growth
Tax History
| Year | Tax Paid | Tax Assessment Tax Assessment Total Assessment is a certain percentage of the fair market value that is determined by local assessors to be the total taxable value of land and additions on the property. | Land | Improvement |
|---|---|---|---|---|
| 2024 | $1,322 | $44,030 | $6,685 | $37,345 |
| 2023 | $2,452 | $39,165 | $5,915 | $33,250 |
| 2022 | $2,456 | $39,165 | $5,915 | $33,250 |
| 2021 | $2,578 | $39,165 | $5,915 | $33,250 |
| 2020 | $2,414 | $32,445 | $4,935 | $27,510 |
| 2019 | $2,354 | $32,445 | $4,935 | $27,510 |
| 2018 | $2,252 | $32,445 | $4,935 | $27,510 |
| 2017 | $2,232 | $29,050 | $6,335 | $22,715 |
| 2016 | $2,170 | $83,000 | $18,100 | $64,900 |
| 2015 | $2,147 | $83,000 | $18,100 | $64,900 |
| 2014 | $1,827 | $29,060 | $6,340 | $22,720 |
| 2013 | $1,827 | $29,060 | $6,340 | $22,720 |
Source: Public Records
Map
Nearby Homes
- 3739 Garrison Rd
- 3646 Garrison Rd
- 3805 Garrison Rd
- 3827 Grantley Rd
- 3832 Grantley Rd
- 3840 Grantley Rd
- 3647 Elmhurst Rd
- 3840 Garrison Rd
- 3832 Woodmont Rd
- 3806 Doty Dr
- 3417 Cheltenham Rd
- 3433 Goddard Rd
- 3512 Rushland Ave
- 2560 Charlestown Ave
- 3951 Buell Ave
- 2513 Portsmouth Ave
- 3512 Wyckliffe Pkwy
- 2447 Portsmouth Ave
- 2433 Georgetown Ave
- 2426 Berdan Ave
- 3727 Bowen Rd
- 3719 Bowen Rd
- 3731 Bowen Rd
- 3715 Bowen Rd
- 3724 Grantley Rd
- 3728 Grantley Rd
- 3720 Grantley Rd
- 3711 Bowen Rd
- 3732 Grantley Rd
- 3716 Grantley Rd
- 3724 Bowen Rd
- 3728 Bowen Rd
- 3720 Bowen Rd
- 3739 Bowen Rd
- 3712 Grantley Rd
- 3705 Bowen Rd
- 3736 Grantley Rd
- 3732 Bowen Rd
- 3716 Bowen Rd
- 3708 Grantley Rd