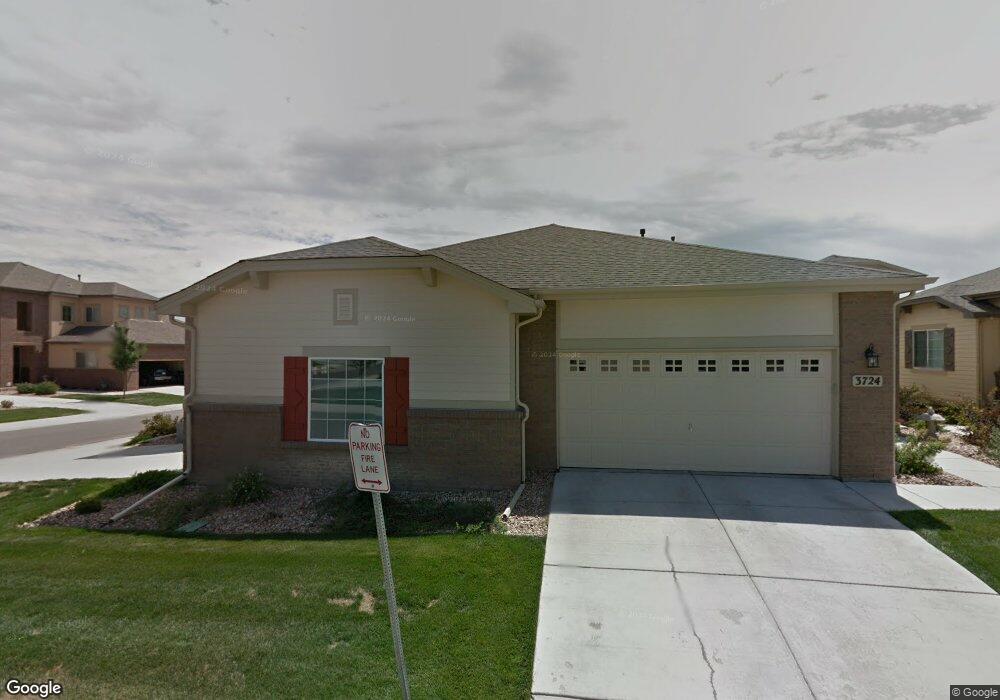
3724 E 128th Place Thornton, CO 80241
Estimated Value: $414,568 - $442,000
2
Beds
2
Baths
2,080
Sq Ft
$208/Sq Ft
Est. Value
About This Home
This home is located at 3724 E 128th Place, Thornton, CO 80241 and is currently estimated at $432,142, approximately $207 per square foot. 3724 E 128th Place is a home located in Adams County with nearby schools including Tarver Elementary School, Century Middle School, and Horizon High School.
Ownership History
Date
Name
Owned For
Owner Type
Purchase Details
Closed on
Nov 29, 2013
Sold by
Pinson Samuel D and Pinson Elsie J
Bought by
Shearer Steven R and Shearer Sherry R
Current Estimated Value
Home Financials for this Owner
Home Financials are based on the most recent Mortgage that was taken out on this home.
Original Mortgage
$248,810
Outstanding Balance
$183,019
Interest Rate
4.12%
Mortgage Type
FHA
Estimated Equity
$249,123
Purchase Details
Closed on
Feb 18, 2010
Sold by
The Veranda Llc
Bought by
Pinson Samuel D and Pinson Elsie J
Home Financials for this Owner
Home Financials are based on the most recent Mortgage that was taken out on this home.
Original Mortgage
$205,164
Interest Rate
4.87%
Mortgage Type
FHA
Create a Home Valuation Report for This Property
The Home Valuation Report is an in-depth analysis detailing your home's value as well as a comparison with similar homes in the area
Purchase History
| Date | Buyer | Sale Price | Title Company |
|---|---|---|---|
| Shearer Steven R | $253,400 | Land Title Guarantee Company | |
| Pinson Samuel D | $208,950 | First American |
Source: Public Records
Mortgage History
| Date | Status | Borrower | Loan Amount |
|---|---|---|---|
| Open | Shearer Steven R | $248,810 | |
| Previous Owner | Pinson Samuel D | $205,164 |
Source: Public Records
Tax History
| Year | Tax Paid | Tax Assessment Tax Assessment Total Assessment is a certain percentage of the fair market value that is determined by local assessors to be the total taxable value of land and additions on the property. | Land | Improvement |
|---|---|---|---|---|
| 2025 | $2,044 | $29,990 | $6,460 | $23,530 |
| 2024 | $2,044 | $27,570 | $5,940 | $21,630 |
| 2023 | $2,718 | $30,230 | $5,610 | $24,620 |
| 2022 | $2,604 | $23,640 | $5,210 | $18,430 |
| 2021 | $2,691 | $23,640 | $5,210 | $18,430 |
| 2020 | $2,666 | $23,900 | $5,360 | $18,540 |
| 2019 | $2,672 | $23,900 | $5,360 | $18,540 |
| 2018 | $2,509 | $21,800 | $2,160 | $19,640 |
| 2017 | $2,281 | $21,800 | $2,160 | $19,640 |
| 2016 | $2,147 | $19,980 | $2,390 | $17,590 |
| 2015 | $2,144 | $19,980 | $2,390 | $17,590 |
| 2014 | -- | $15,260 | $2,390 | $12,870 |
Source: Public Records
Map
Nearby Homes
- 3670 E 128th Place
- 12804 Harrison St
- 13004 Harrison Dr
- 12711 Colorado Blvd Unit 108A
- 12711 Colorado Blvd Unit 314C
- 13064 Garfield Dr
- 12829 Cook Dr
- 13055 Harrison Dr
- 12672 Madison Ct
- 13064 Harrison Dr
- 13068 Harrison Dr
- 12993 Birch Dr
- 12791 Clermont St
- 12458 Albion St
- 12332 Colorado Blvd Unit 30
- 3867 E 133rd Ct
- 3225 E 124th Ave
- 4087 E 133rd Cir
- 12312 Colorado Blvd Unit 10
- 4756 E 129th Place
- 3726 E 128th Place
- 3722 E 128th Place
- 3725 E 128th Place
- 3720 E 128th Place
- 3715 E 128th Ct
- 3717 E 128th Ct
- 3713 E 128th Ct
- 3727 E 128th Place
- 3723 E 128th Place
- 12858 Jackson Cir
- 12850 Jackson Cir
- 3721 E 128th Place
- 12862 Jackson Cir
- 3711 E 128th Ct
- 12866 Jackson Cir
- 3650 E 128th Place
- 3660 E 128th Place
- 3640 E 128th Place
- 12846 Jackson Cir
- 12870 Jackson Cir
Your Personal Tour Guide
Ask me questions while you tour the home.