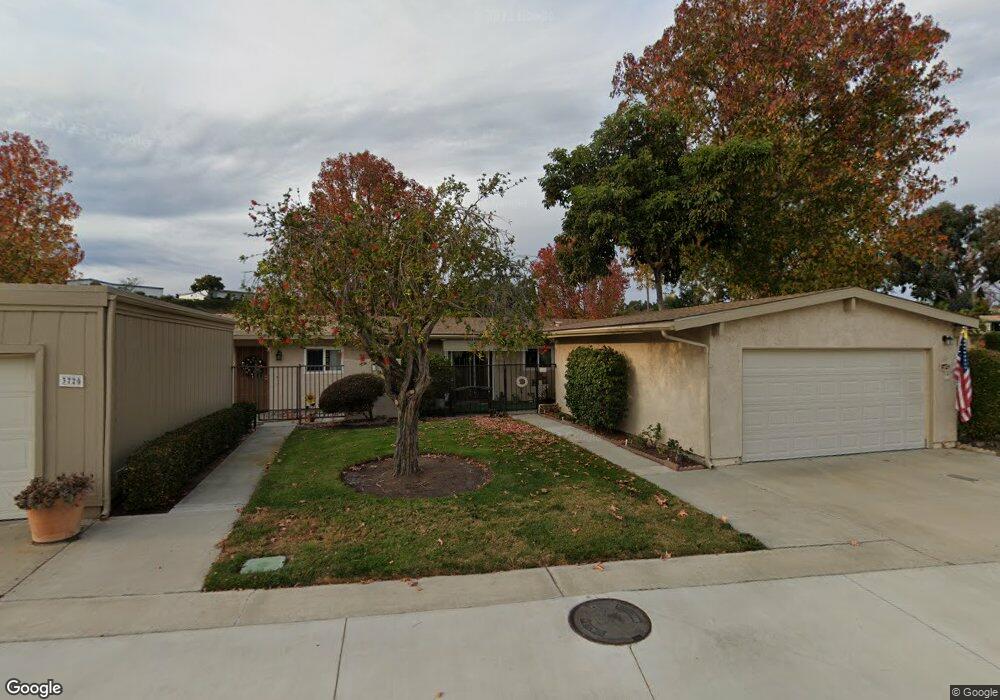
3724 Ginger Way Oceanside, CA 92057
Oceana NeighborhoodEstimated Value: $477,496 - $513,000
2
Beds
2
Baths
1,122
Sq Ft
$439/Sq Ft
Est. Value
About This Home
This home is located at 3724 Ginger Way, Oceanside, CA 92057 and is currently estimated at $492,624, approximately $439 per square foot. 3724 Ginger Way is a home located in San Diego County with nearby schools including San Luis Rey Elementary School, Martin Luther King Jr. Middle School, and El Camino High School.
Ownership History
Date
Name
Owned For
Owner Type
Purchase Details
Closed on
Jul 10, 2013
Sold by
Wicks Cara Lou
Bought by
Wicks Cara Lou
Current Estimated Value
Home Financials for this Owner
Home Financials are based on the most recent Mortgage that was taken out on this home.
Original Mortgage
$86,468
Outstanding Balance
$62,768
Interest Rate
3.88%
Mortgage Type
New Conventional
Estimated Equity
$429,856
Purchase Details
Closed on
May 24, 2005
Sold by
Wicks Cara Lou
Bought by
Wicks Cara Lou
Purchase Details
Closed on
Oct 4, 1994
Sold by
Flint Goodson John I and Flint Goodson Elnore J
Bought by
Wicks Cara Lou
Home Financials for this Owner
Home Financials are based on the most recent Mortgage that was taken out on this home.
Original Mortgage
$63,750
Interest Rate
8.91%
Purchase Details
Closed on
Oct 27, 1992
Create a Home Valuation Report for This Property
The Home Valuation Report is an in-depth analysis detailing your home's value as well as a comparison with similar homes in the area
Home Values in the Area
Average Home Value in this Area
Purchase History
| Date | Buyer | Sale Price | Title Company |
|---|---|---|---|
| Wicks Cara Lou | -- | First American Title Company | |
| Wicks Cara Lou | -- | First American Title Company | |
| Wicks Cara Lou | -- | -- | |
| Wicks Cara Lou | $85,000 | Commonwealth Land Title | |
| -- | $85,000 | -- |
Source: Public Records
Mortgage History
| Date | Status | Borrower | Loan Amount |
|---|---|---|---|
| Open | Wicks Cara Lou | $86,468 | |
| Previous Owner | Wicks Cara Lou | $63,750 |
Source: Public Records
Tax History
| Year | Tax Paid | Tax Assessment Tax Assessment Total Assessment is a certain percentage of the fair market value that is determined by local assessors to be the total taxable value of land and additions on the property. | Land | Improvement |
|---|---|---|---|---|
| 2025 | $1,524 | $142,739 | $50,374 | $92,365 |
| 2024 | $1,524 | $139,941 | $49,387 | $90,554 |
| 2023 | $1,475 | $137,198 | $48,419 | $88,779 |
| 2022 | $1,451 | $134,509 | $47,470 | $87,039 |
| 2021 | $1,455 | $131,873 | $46,540 | $85,333 |
| 2020 | $1,410 | $130,522 | $46,063 | $84,459 |
| 2019 | $1,368 | $127,963 | $45,160 | $82,803 |
| 2018 | $1,352 | $125,455 | $44,275 | $81,180 |
| 2017 | $70 | $122,996 | $43,407 | $79,589 |
| 2016 | $1,280 | $120,585 | $42,556 | $78,029 |
| 2015 | $1,242 | $118,774 | $41,917 | $76,857 |
| 2014 | $1,194 | $116,448 | $41,096 | $75,352 |
Source: Public Records
Map
Nearby Homes
- 3743 Rosemary Way
- 3839 Vista Campana S Unit 42
- 3839 Vista Campana S Unit 6
- 3747 Vista Campana S Unit 35
- 3808 Vista Campana S
- 3875 Vista Campana S Unit 32
- 3743 Hickory Way
- 3760 Vista Campana S Unit 76
- 3760 Vista Campana S Unit 15
- 3760 Vista Campana S Unit 81
- 3755 Vista Campana N Unit 34
- 3755 Vista Campana N Unit 30
- 3755 Vista Campana N Unit 45
- 3890 Vista Campana S Unit 39
- 3890 Vista Campana S Unit 78
- 3625 Dearborn St
- 3685 Vista Campana N
- 3631 Brandywine St
- 3902 Vista Campana N Unit 62
- 3902 Vista Campana N Unit 12
- 3720 Ginger Way
- 3716 Ginger Way
- 3712 Ginger Way
- 830 Parsley Way
- 3725 Ginger Way
- 3721 Ginger Way
- 824 Parsley Way
- 3717 Ginger Way
- 818 Parsley Way
- 3729 Ginger Way
- 3730 Ginger Way
- 3713 Ginger Way
- 812 Parsley Way
- 3733 Ginger Way
- 3734 Ginger Way
- 3709 Ginger Way
- 837 Parsley Way Unit 1
- 831 Parsley Way
- 843 Parsley Way
- 849 Parsley Way Unit 1
Your Personal Tour Guide
Ask me questions while you tour the home.