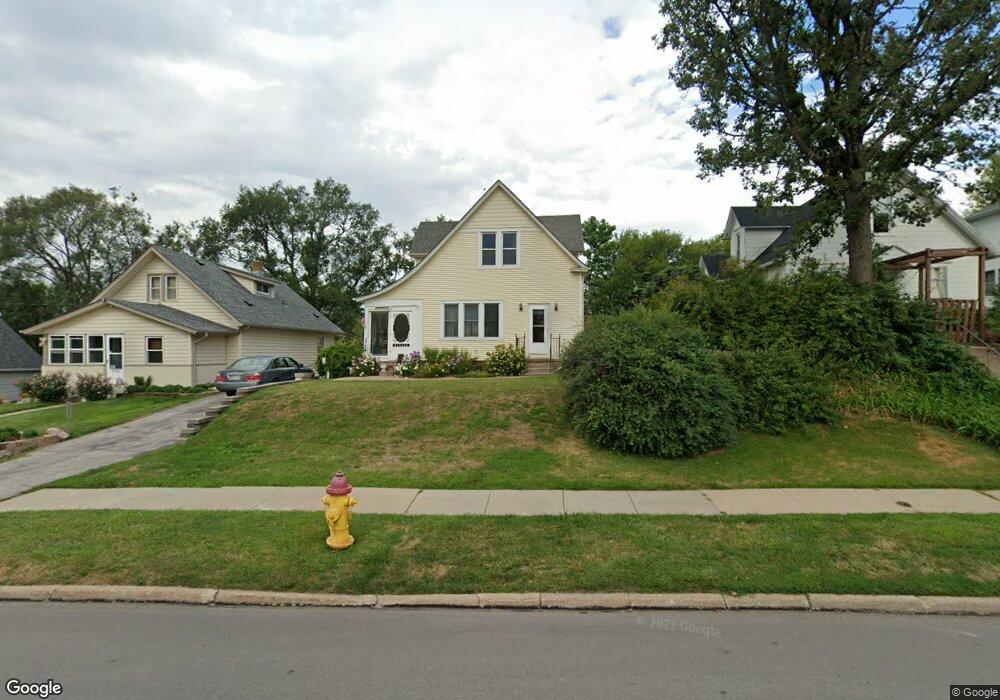
3724 S 16th St Omaha, NE 68107
South Central Omaha NeighborhoodEstimated Value: $200,000 - $264,000
3
Beds
3
Baths
1,340
Sq Ft
$165/Sq Ft
Est. Value
About This Home
This home is located at 3724 S 16th St, Omaha, NE 68107 and is currently estimated at $221,662, approximately $165 per square foot. 3724 S 16th St is a home located in Douglas County with nearby schools including Spring Lake Magnet Center, R.M. Marrs Magnet Middle School, and South High Magnet School.
Ownership History
Date
Name
Owned For
Owner Type
Purchase Details
Closed on
Mar 21, 2011
Sold by
Kimes Kenneth L and Kimes Sharon L
Bought by
Wilkens James D and Wilkens Laurie A
Current Estimated Value
Home Financials for this Owner
Home Financials are based on the most recent Mortgage that was taken out on this home.
Original Mortgage
$101,500
Outstanding Balance
$70,556
Interest Rate
5.04%
Mortgage Type
VA
Estimated Equity
$151,106
Purchase Details
Closed on
Sep 10, 2003
Sold by
Horenkamp Gary F
Bought by
Linden Robert E and Linden Sandra J
Create a Home Valuation Report for This Property
The Home Valuation Report is an in-depth analysis detailing your home's value as well as a comparison with similar homes in the area
Home Values in the Area
Average Home Value in this Area
Purchase History
| Date | Buyer | Sale Price | Title Company |
|---|---|---|---|
| Wilkens James D | $118,000 | None Available | |
| Linden Robert E | $70,000 | -- |
Source: Public Records
Mortgage History
| Date | Status | Borrower | Loan Amount |
|---|---|---|---|
| Open | Wilkens James D | $101,500 |
Source: Public Records
Tax History
| Year | Tax Paid | Tax Assessment Tax Assessment Total Assessment is a certain percentage of the fair market value that is determined by local assessors to be the total taxable value of land and additions on the property. | Land | Improvement |
|---|---|---|---|---|
| 2025 | $3,188 | $188,600 | $16,100 | $172,500 |
| 2024 | $3,000 | $188,600 | $16,100 | $172,500 |
| 2023 | $3,000 | $142,200 | $16,100 | $126,100 |
| 2022 | $2,880 | $134,900 | $8,800 | $126,100 |
| 2021 | $2,407 | $113,700 | $8,800 | $104,900 |
| 2020 | $2,434 | $113,700 | $8,800 | $104,900 |
| 2019 | $2,353 | $109,600 | $8,800 | $100,800 |
| 2018 | $2,036 | $94,700 | $8,800 | $85,900 |
| 2017 | $2,852 | $132,000 | $4,900 | $127,100 |
| 2016 | $2,832 | $132,000 | $4,900 | $127,100 |
| 2015 | $2,795 | $132,000 | $4,900 | $127,100 |
| 2014 | $2,795 | $132,000 | $4,900 | $127,100 |
Source: Public Records
Map
Nearby Homes
Your Personal Tour Guide
Ask me questions while you tour the home.