Estimated Value: $459,000 - $542,000
About This Home
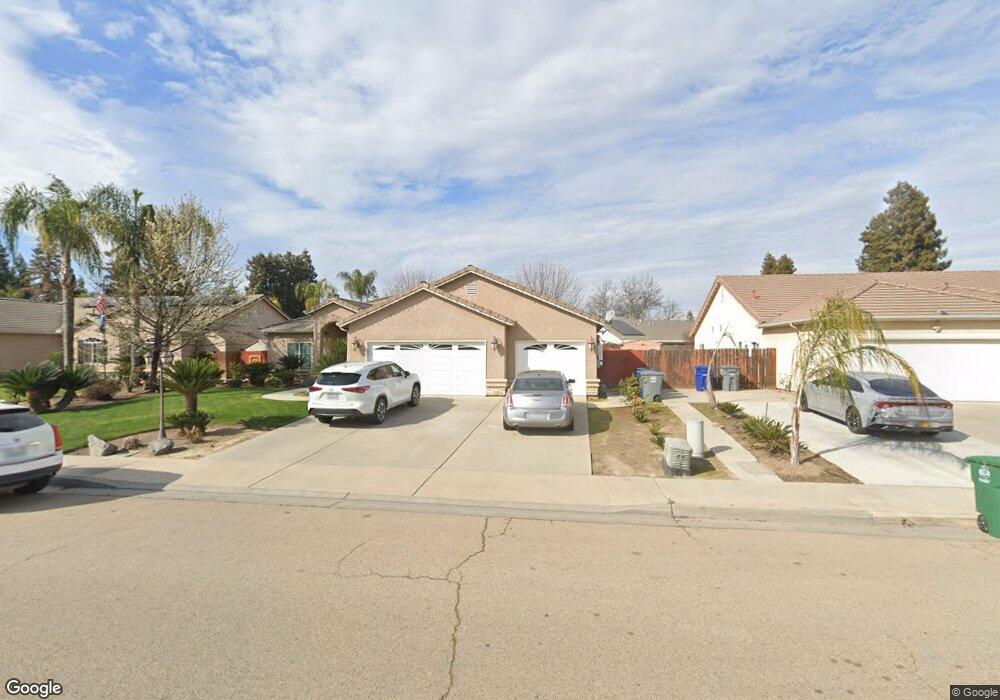
This home is located at 3725 Olive St, Selma, CA 93662 and is currently estimated at $509,386, approximately $204 per square foot. 3725 Olive St is a home located in Fresno County with nearby schools including Indianola Elementary School, Abraham Lincoln Middle School, and Selma High School.
Ownership History
We collect this data history from publicly available records. To have your information removed, we recommend requesting removal directly through your county’s website.
Purchase Details
Home Financials for this Owner
Home Financials are based on the most recent Mortgage that was taken out on this home.Purchase Details
Home Values in the Area
Average Home Value in this Area
Purchase History
We collect this data history from publicly available records. To have your information removed, we recommend requesting removal directly through your county’s website.
| Date | Buyer | Sale Price | Title Company |
|---|---|---|---|
| $286,500 | Financial Title Company | ||
| -- | Financial Title Company | ||
| -- | Financial Title Company |
Mortgage History
We collect this data history from publicly available records. To have your information removed, we recommend requesting removal directly through your county’s website.
| Date | Status | Borrower | Loan Amount |
|---|---|---|---|
| Open | $272,100 |
Tax History
We collect this data history from publicly available records. To have your information removed, we recommend requesting removal directly through your county’s website.
| Year | Tax Paid | Tax Assessment Tax Assessment Total Assessment is a certain percentage of the fair market value that is determined by local assessors to be the total taxable value of land and additions on the property. | Land | Improvement |
|---|---|---|---|---|
| 2025 | $5,708 | $399,203 | $97,567 | $301,636 |
| 2023 | $5,618 | $383,703 | $93,779 | $289,924 |
| 2022 | $5,276 | $376,181 | $91,941 | $284,240 |
| 2021 | $5,161 | $368,806 | $90,139 | $278,667 |
| 2020 | $5,126 | $365,025 | $89,215 | $275,810 |
| 2019 | $4,638 | $325,000 | $70,000 | $255,000 |
| 2018 | $4,214 | $290,700 | $71,400 | $219,300 |
| 2017 | $4,112 | $285,000 | $70,000 | $215,000 |
| 2016 | $3,607 | $270,000 | $70,000 | $200,000 |
| 2015 | $3,878 | $285,000 | $55,000 | $230,000 |
| 2014 | $2,988 | $207,000 | $50,400 | $156,600 |
Map
- 3510 Woodrow St
- 1444 Nelson Blvd
- 1245 Northhill St
- 3502 Dockery Ave
- 1701 Dinuba Ave Unit 64
- 1701 Dinuba Ave Unit 40
- 1701 Dinuba Ave Unit 180
- 1701 Dinuba Ave Unit 110
- 1701 Dinuba Ave Unit 140
- 1418 Jackson St
- 1506 Hope St
- 1340 Lewis St
- 1305 Barbara St
- 3280 Mccall Ave
- 3055 Love St
- 2210 Northhill St
- 3239 Lee St
- 2003 Dennis Dr
- 2222 Barbara St
- 3517 Howard St
- 3701 Olive St
- 3707 Olive St
- 1337 Goldridge St
- 1428 Goldridge St
- 1427 Goldridge St
- 3713 Olive St
- 1331 Goldridge St
- 1326 Goldridge St
- 1434 Goldridge St
- 1414 Northhill St
- 1325 Goldridge St
- 1420 Northhill St
- 1433 Goldridge St
- 1408 Northhill St
- 3719 Olive St
- 1426 Northhill St
- 1398 Northhill St
- 1327 Hicks St
- 1320 Goldridge St
- 1435 Hicks St
Ask me questions while you tour the home.