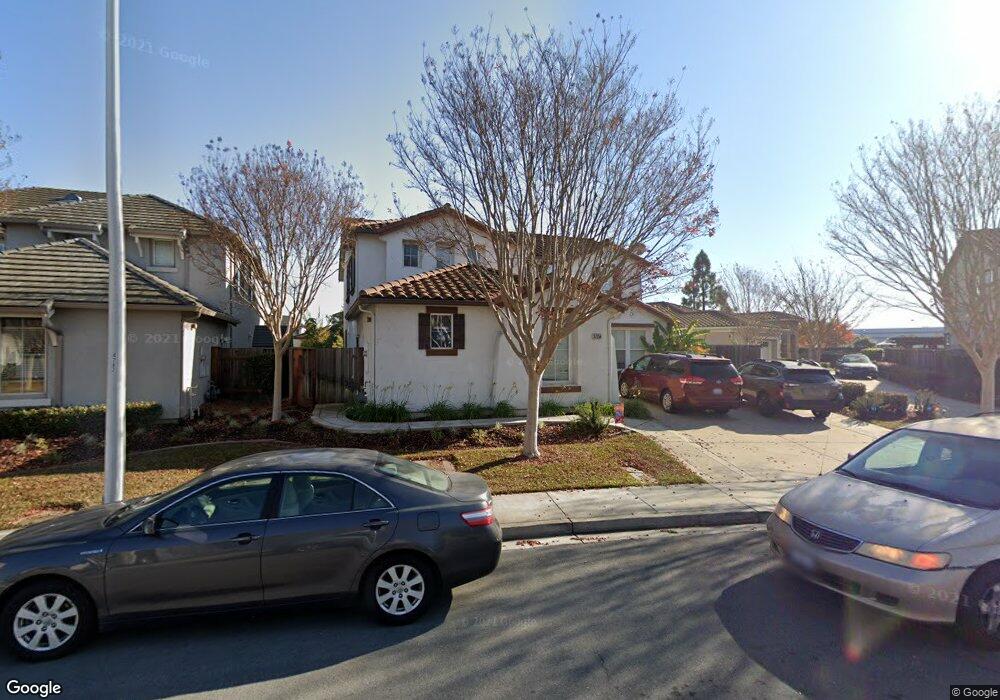
37256 Acorn Place Newark, CA 94560
Estimated Value: $1,960,000 - $2,380,000
5
Beds
3
Baths
3,315
Sq Ft
$662/Sq Ft
Est. Value
About This Home
This home is located at 37256 Acorn Place, Newark, CA 94560 and is currently estimated at $2,193,595, approximately $661 per square foot. 37256 Acorn Place is a home located in Alameda County with nearby schools including August Schilling Elementary School, Newark Junior High School, and Newark Memorial High School.
Ownership History
Date
Name
Owned For
Owner Type
Purchase Details
Closed on
Sep 11, 2002
Sold by
Wong Ronald S
Bought by
Wong Ronald S and Wong Jonathan S
Current Estimated Value
Home Financials for this Owner
Home Financials are based on the most recent Mortgage that was taken out on this home.
Original Mortgage
$506,704
Outstanding Balance
$212,571
Interest Rate
6.43%
Mortgage Type
Stand Alone First
Estimated Equity
$1,981,024
Purchase Details
Closed on
Aug 6, 2002
Sold by
Kb Home South Bay Inc
Bought by
Wong Ronald S
Home Financials for this Owner
Home Financials are based on the most recent Mortgage that was taken out on this home.
Original Mortgage
$506,704
Outstanding Balance
$212,571
Interest Rate
6.43%
Mortgage Type
Stand Alone First
Estimated Equity
$1,981,024
Create a Home Valuation Report for This Property
The Home Valuation Report is an in-depth analysis detailing your home's value as well as a comparison with similar homes in the area
Home Values in the Area
Average Home Value in this Area
Purchase History
| Date | Buyer | Sale Price | Title Company |
|---|---|---|---|
| Wong Ronald S | -- | -- | |
| Wong Ronald S | $633,500 | First American Title Guarant |
Source: Public Records
Mortgage History
| Date | Status | Borrower | Loan Amount |
|---|---|---|---|
| Open | Wong Ronald S | $506,704 |
Source: Public Records
Tax History Compared to Growth
Tax History
| Year | Tax Paid | Tax Assessment Tax Assessment Total Assessment is a certain percentage of the fair market value that is determined by local assessors to be the total taxable value of land and additions on the property. | Land | Improvement |
|---|---|---|---|---|
| 2025 | $11,048 | $910,145 | $275,158 | $641,987 |
| 2024 | $11,048 | $892,164 | $269,763 | $629,401 |
| 2023 | $10,756 | $881,540 | $264,476 | $617,064 |
| 2022 | $10,629 | $857,258 | $259,291 | $604,967 |
| 2021 | $10,361 | $840,316 | $254,208 | $593,108 |
| 2020 | $10,253 | $838,634 | $251,603 | $587,031 |
| 2019 | $10,103 | $822,194 | $246,671 | $575,523 |
| 2018 | $9,955 | $806,076 | $241,835 | $564,241 |
| 2017 | $9,702 | $790,275 | $237,095 | $553,180 |
| 2016 | $9,610 | $774,784 | $232,447 | $542,337 |
| 2015 | $9,578 | $763,151 | $228,957 | $534,194 |
| 2014 | $9,321 | $748,205 | $224,473 | $523,732 |
Source: Public Records
Map
Nearby Homes
- 37000 Poplar St Unit 37006
- 37051 Walnut St
- 7843 Railroad Ave
- 8360 Marine Way
- 36985 Walnut St
- 37356 Suncrest St
- 37561 Breakers Rd
- 37721 Bay Crest Rd
- 37553 Shelter Rd
- 8512 Bayshores Ave
- 8629 Seawind Way
- 8550 Boardwalk Way
- 37537 Estuary St
- 8536 Jetty Way
- 9263 Vista Cove Way
- 9173 Whitesurf Way
- 9355 Ocean Park Way
- 37898 Seafarer Rd
- 37413 Bowline Rd
- 37256 Sand Bar Place
- 37248 Acorn Place
- 37262 Acorn Place
- 8153 Wells Ave
- 37270 Acorn Place
- 37240 Acorn Place
- 8142 Mandarin Ave
- 8141 Wells Ave
- 37251 Acorn Place
- 37286 Acorn Place
- 8130 Mandarin Ave
- 37235 Acorn Place Unit A,C,D
- 37235 Acorn Place Unit A,B,C,D
- 37235 Acorn Place
- 8129 Wells Ave
- 37283 Acorn Place
- 37267 Acorn Place
- 37299 Acorn Place
- 8212 Mandarin Ave
- 8118 Mandarin Ave
- 8135 Mandarin Ave