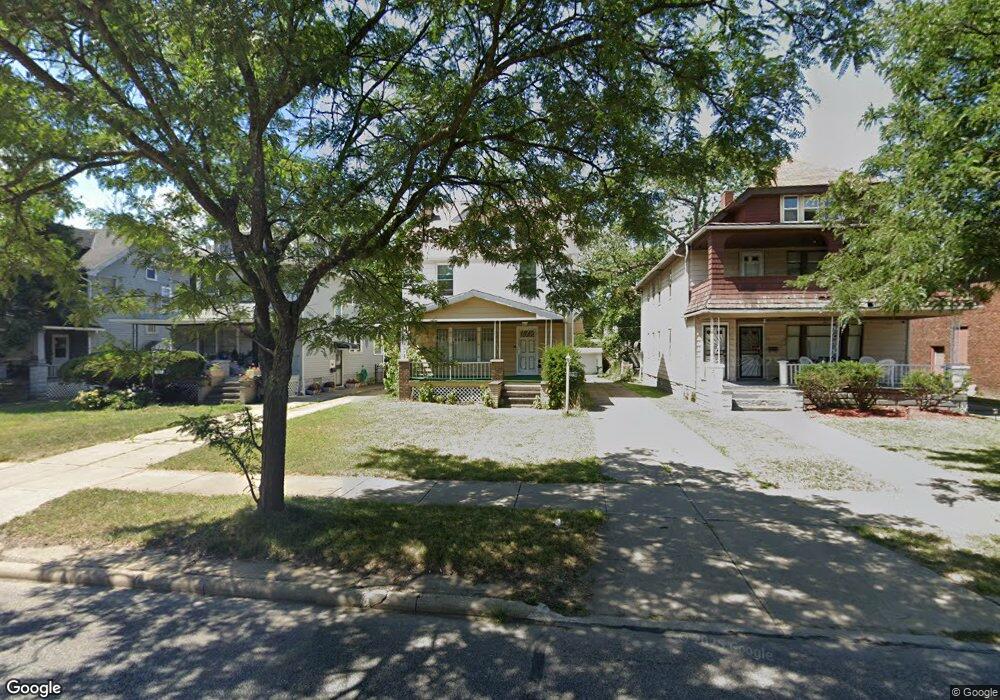
3726 E 140th St Cleveland, OH 44120
Mount Pleasant NeighborhoodEstimated Value: $80,000 - $95,000
3
Beds
1
Bath
1,544
Sq Ft
$55/Sq Ft
Est. Value
About This Home
This home is located at 3726 E 140th St, Cleveland, OH 44120 and is currently estimated at $84,433, approximately $54 per square foot. 3726 E 140th St is a home located in Cuyahoga County.
Ownership History
Date
Name
Owned For
Owner Type
Purchase Details
Closed on
Dec 25, 2022
Sold by
Trotter Maria A
Bought by
Bonner David C
Current Estimated Value
Purchase Details
Closed on
Sep 21, 2005
Sold by
Trotter Maria A and Bonner David C
Bought by
Trotter Maria A
Home Financials for this Owner
Home Financials are based on the most recent Mortgage that was taken out on this home.
Original Mortgage
$68,550
Interest Rate
6.54%
Mortgage Type
Fannie Mae Freddie Mac
Purchase Details
Closed on
May 31, 1995
Sold by
Spikes Lillie B
Bought by
Trotter Maria A and Bonner David C
Home Financials for this Owner
Home Financials are based on the most recent Mortgage that was taken out on this home.
Original Mortgage
$61,450
Interest Rate
8.26%
Mortgage Type
FHA
Purchase Details
Closed on
Jun 2, 1992
Sold by
Spikes John H and Spikes Lillian B
Bought by
Spikes John H
Purchase Details
Closed on
Jan 1, 1975
Bought by
Spikes John H and Spikes Lillian B
Create a Home Valuation Report for This Property
The Home Valuation Report is an in-depth analysis detailing your home's value as well as a comparison with similar homes in the area
Home Values in the Area
Average Home Value in this Area
Purchase History
| Date | Buyer | Sale Price | Title Company |
|---|---|---|---|
| Bonner David C | -- | None Listed On Document | |
| Trotter Maria A | $27,800 | None Available | |
| Trotter Maria A | $61,500 | -- | |
| Spikes John H | -- | -- | |
| Spikes John H | -- | -- |
Source: Public Records
Mortgage History
| Date | Status | Borrower | Loan Amount |
|---|---|---|---|
| Previous Owner | Trotter Maria A | $68,550 | |
| Previous Owner | Trotter Maria A | $61,450 |
Source: Public Records
Tax History
| Year | Tax Paid | Tax Assessment Tax Assessment Total Assessment is a certain percentage of the fair market value that is determined by local assessors to be the total taxable value of land and additions on the property. | Land | Improvement |
|---|---|---|---|---|
| 2024 | $815 | $22,225 | $5,320 | $16,905 |
| 2023 | $401 | $14,460 | $3,220 | $11,240 |
| 2022 | $431 | $14,460 | $3,220 | $11,240 |
| 2021 | $426 | $14,460 | $3,220 | $11,240 |
| 2020 | $321 | $12,460 | $2,770 | $9,700 |
| 2019 | $996 | $35,600 | $7,900 | $27,700 |
| 2018 | $1,062 | $12,460 | $2,770 | $9,700 |
| 2017 | $1,140 | $13,830 | $3,190 | $10,640 |
| 2016 | $1,132 | $13,830 | $3,190 | $10,640 |
| 2015 | $1,136 | $13,830 | $3,190 | $10,640 |
| 2014 | $1,136 | $13,830 | $3,190 | $10,640 |
Source: Public Records
Map
Nearby Homes
- 3677 E 143rd St
- 3732 E 144th St
- 13509 Svec Ave
- 13617 Horner Ave
- 3634 E 143rd St
- 3731 E 144th St
- 3610 E 140th St
- 3598 E 139th St
- 3642 E 144th St
- 3613 E 135th St
- 3840 E 142nd St
- 3606 E 143rd St
- 13305 Svec Ave
- 3790 E 146th St
- 3565 E 139th St
- 3636 E 146th St
- 3661 E 146th St
- 3833 E 144th St
- 13901 Chapelside Ave
- 3548 E 138th St
- 3724 E 140th St
- 3730 E 140th St
- 3718 E 140th St
- 3734 E 140th St
- 13912 Melzer Ave
- 13910 Melzer Ave
- 3742 E 140th St
- 13917 Bartlett Ave
- 13913 Bartlett Ave
- 3710 E 140th St
- 13906 Melzer Ave
- 3719 E 140th St
- 13909 Bartlett Ave
- 3733 E 140th St
- 3706 E 140th St
- 13902 Melzer Ave
- 3727 E 140th St
- 3723 E 140th St
- 3737 E 140th St
- 13913 Melzer Ave
Your Personal Tour Guide
Ask me questions while you tour the home.