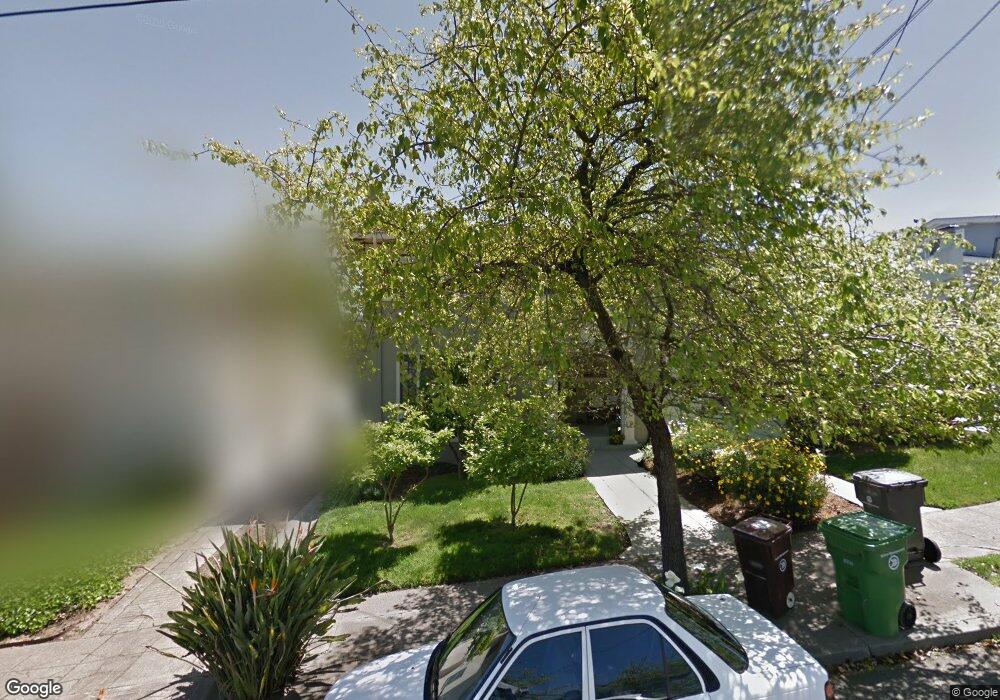
3726 Linwood Ave Oakland, CA 94602
Glenview NeighborhoodEstimated Value: $1,034,000 - $1,463,000
4
Beds
2
Baths
1,985
Sq Ft
$622/Sq Ft
Est. Value
About This Home
This home is located at 3726 Linwood Ave, Oakland, CA 94602 and is currently estimated at $1,234,218, approximately $621 per square foot. 3726 Linwood Ave is a home located in Alameda County with nearby schools including Glenview Elementary School, Edna Brewer Middle School, and Oakland High School.
Ownership History
Date
Name
Owned For
Owner Type
Purchase Details
Closed on
Apr 4, 2006
Sold by
Moss Richard P and Brackenridge Catherine H
Bought by
Moss Richard P and Brackenridge Catherine
Current Estimated Value
Purchase Details
Closed on
Nov 27, 2002
Sold by
Cohen Samuel D
Bought by
Moss Richard P and Brackenridge Catherine H
Home Financials for this Owner
Home Financials are based on the most recent Mortgage that was taken out on this home.
Original Mortgage
$497,600
Outstanding Balance
$200,322
Interest Rate
5.37%
Mortgage Type
Purchase Money Mortgage
Estimated Equity
$1,033,896
Purchase Details
Closed on
Dec 13, 2000
Sold by
Cohen Catherine B
Bought by
Cohen Samuel D
Home Financials for this Owner
Home Financials are based on the most recent Mortgage that was taken out on this home.
Original Mortgage
$200,000
Interest Rate
7.71%
Mortgage Type
Credit Line Revolving
Create a Home Valuation Report for This Property
The Home Valuation Report is an in-depth analysis detailing your home's value as well as a comparison with similar homes in the area
Home Values in the Area
Average Home Value in this Area
Purchase History
| Date | Buyer | Sale Price | Title Company |
|---|---|---|---|
| Moss Richard P | -- | None Available | |
| Moss Richard P | $622,000 | Old Republic Title Company | |
| Cohen Samuel D | -- | Old Republic Title Company | |
| Cohen Samuel D | $100,000 | Fidelity National Title Co |
Source: Public Records
Mortgage History
| Date | Status | Borrower | Loan Amount |
|---|---|---|---|
| Open | Moss Richard P | $497,600 | |
| Previous Owner | Cohen Samuel D | $200,000 | |
| Closed | Moss Richard P | $93,300 |
Source: Public Records
Tax History Compared to Growth
Tax History
| Year | Tax Paid | Tax Assessment Tax Assessment Total Assessment is a certain percentage of the fair market value that is determined by local assessors to be the total taxable value of land and additions on the property. | Land | Improvement |
|---|---|---|---|---|
| 2025 | $12,890 | $908,060 | $270,234 | $644,826 |
| 2024 | $12,890 | $876,121 | $264,936 | $618,185 |
| 2023 | $13,705 | $865,811 | $259,743 | $606,068 |
| 2022 | $13,260 | $841,837 | $254,651 | $594,186 |
| 2021 | $12,755 | $825,198 | $249,659 | $582,539 |
| 2020 | $12,616 | $823,670 | $247,101 | $576,569 |
| 2019 | $12,191 | $807,523 | $242,257 | $565,266 |
| 2018 | $11,936 | $791,693 | $237,508 | $554,185 |
| 2017 | $11,498 | $776,174 | $232,852 | $543,322 |
| 2016 | $11,165 | $760,960 | $228,288 | $532,672 |
| 2015 | $11,109 | $749,534 | $224,860 | $524,674 |
| 2014 | $11,309 | $734,854 | $220,456 | $514,398 |
Source: Public Records
Map
Nearby Homes
- 3541 Dimond Ave
- 1621 E 38th St
- 1703 Macarthur Blvd
- 1515 Hampel St
- 1701 Macarthur Blvd
- 2240 Macarthur Blvd
- 2106 Woodbine Ave
- 3945 Randolph Ave Unit 2
- 2550 Pleasant St
- 3847 Fruitvale Ave
- 4426 Park Blvd
- 1235 Hampel St
- 1233 Hampel St
- 3477 Boston Ave Unit 4
- 3220 Champion St
- 3887 Forest Hill Ave
- 2628 School St
- 1600 E 31st St
- 3720 Linwood Ave
- 3732 Linwood Ave
- 1763 Evers Ave
- 3714 Linwood Ave
- 3708 Linwood Ave
- 3742 Linwood Ave
- 1957 E 38th St
- 1771 Evers Ave
- 1764 Excelsior Ave
- 1951 E 38th St
- 1851 E 38th St
- 1752 Excelsior Ave
- 1770 Excelsior Ave
- 3746 Linwood Ave
- 3727 Linwood Ave
- 3725 Linwood Ave
- 1843 E 38th St
- 3733 Linwood Ave
- 1778 Excelsior Ave
- 3715 Linwood Ave