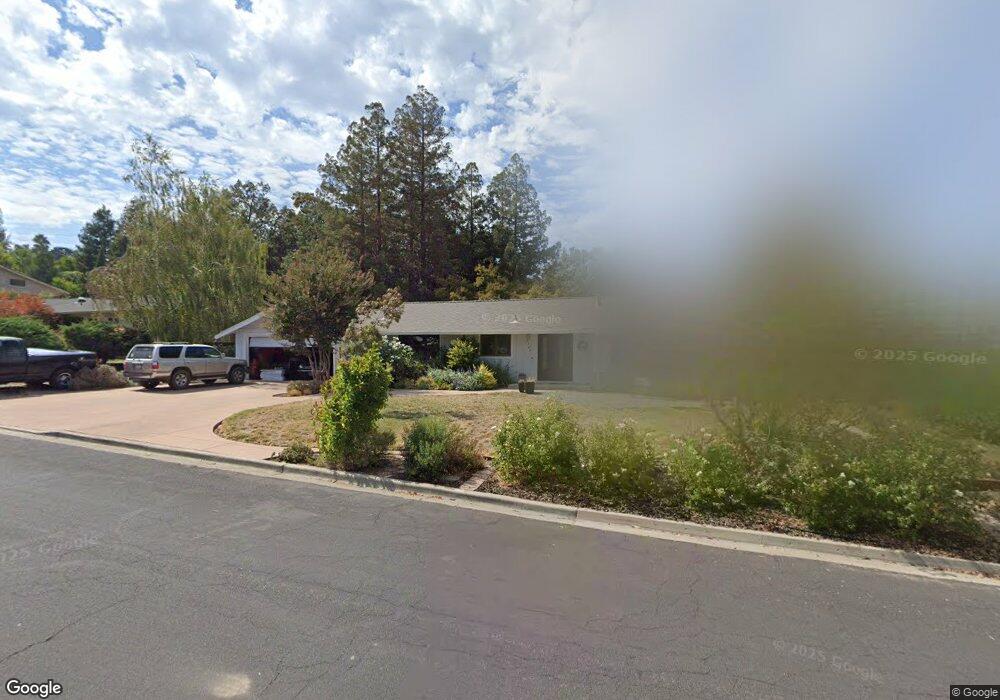
3726 Northridge Dr Concord, CA 94518
Cowell Terrace NeighborhoodEstimated Value: $1,011,000 - $1,171,000
3
Beds
2
Baths
1,604
Sq Ft
$667/Sq Ft
Est. Value
About This Home
This home is located at 3726 Northridge Dr, Concord, CA 94518 and is currently estimated at $1,070,269, approximately $667 per square foot. 3726 Northridge Dr is a home located in Contra Costa County with nearby schools including El Monte Elementary School, El Dorado Middle School, and Concord High School.
Ownership History
Date
Name
Owned For
Owner Type
Purchase Details
Closed on
May 29, 2025
Sold by
Fischer Cindy S and Fischer Cynthia S
Bought by
Fischer Family Trust and Fischer
Current Estimated Value
Purchase Details
Closed on
Oct 18, 2018
Sold by
Ensler David Gregory and Ensler Jennifer Denise
Bought by
Fischer James G and Fischer Cindy S
Home Financials for this Owner
Home Financials are based on the most recent Mortgage that was taken out on this home.
Original Mortgage
$557,000
Interest Rate
4.6%
Mortgage Type
New Conventional
Purchase Details
Closed on
May 24, 2016
Sold by
Helms L Jay and Oloughlin Theresa C
Bought by
Ensler David Gregory and Ensler Jennifer Denise
Purchase Details
Closed on
Dec 17, 2001
Sold by
Helms L Jay and Oloughlin Theresa C
Bought by
Helms L Jay and Oloughlin Theresa C
Create a Home Valuation Report for This Property
The Home Valuation Report is an in-depth analysis detailing your home's value as well as a comparison with similar homes in the area
Home Values in the Area
Average Home Value in this Area
Purchase History
| Date | Buyer | Sale Price | Title Company |
|---|---|---|---|
| Fischer Family Trust | -- | None Listed On Document | |
| Fischer James G | $780,000 | Placer Title Company | |
| Ensler David Gregory | $727,000 | Old Republic Title Company | |
| Helms L Jay | -- | -- |
Source: Public Records
Mortgage History
| Date | Status | Borrower | Loan Amount |
|---|---|---|---|
| Previous Owner | Fischer James G | $557,000 |
Source: Public Records
Tax History
| Year | Tax Paid | Tax Assessment Tax Assessment Total Assessment is a certain percentage of the fair market value that is determined by local assessors to be the total taxable value of land and additions on the property. | Land | Improvement |
|---|---|---|---|---|
| 2025 | $10,615 | $870,098 | $569,915 | $300,183 |
| 2024 | $10,169 | $853,039 | $558,741 | $294,298 |
| 2023 | $10,169 | $836,314 | $547,786 | $288,528 |
| 2022 | $10,046 | $819,917 | $537,046 | $282,871 |
| 2021 | $9,809 | $803,841 | $526,516 | $277,325 |
| 2019 | $9,631 | $780,000 | $510,900 | $269,100 |
| 2018 | $9,180 | $756,370 | $477,023 | $279,347 |
| 2017 | $8,884 | $741,540 | $467,670 | $273,870 |
| 2016 | $3,746 | $281,369 | $86,081 | $195,288 |
| 2015 | $3,607 | $277,143 | $84,788 | $192,355 |
| 2014 | $3,526 | $271,716 | $83,128 | $188,588 |
Source: Public Records
Map
Nearby Homes
- 3739 Northridge Dr
- 1084 Jamie Dr
- 91 Terrace Ct
- 20 Terrace Dr
- 141 Scenic Dr
- 4044 Cowell Rd
- 32 Galloway Dr
- 177 Rose Marie Ln
- 4055 Kimberly Place
- 36 Galloway Dr
- 42 Galloway Dr
- 65 Palm Ln
- 6 Hanford Ave
- 26 David Dr
- 18 Galloway Dr
- 4252 El Cerrito Rd
- 3562 Kimball Way
- 81 Eileen Ln
- 4095 Hamlet Dr
- 4058 Treat Blvd
- 3732 Northridge Dr
- 1116 Saint Francis Dr
- 1110 Saint Francis Dr
- 37008 Cooley Dr
- 3727 Northridge Dr
- 3704 Northridge Dr
- 3733 Northridge Dr
- 3738 Northridge Dr
- 1098 Saint Francis Dr
- 3721 Northridge Dr
- 3715 Northridge Dr
- 3709 Northridge Dr
- 3763 Valinda Dr
- 3760 Cooley Dr
- 3744 Northridge Dr
- 3764 Valinda Dr
- 3745 Northridge Dr
- 1092 Saint Francis Dr
- 3703 Northridge Dr
- 3698 Northridge Dr
Your Personal Tour Guide
Ask me questions while you tour the home.