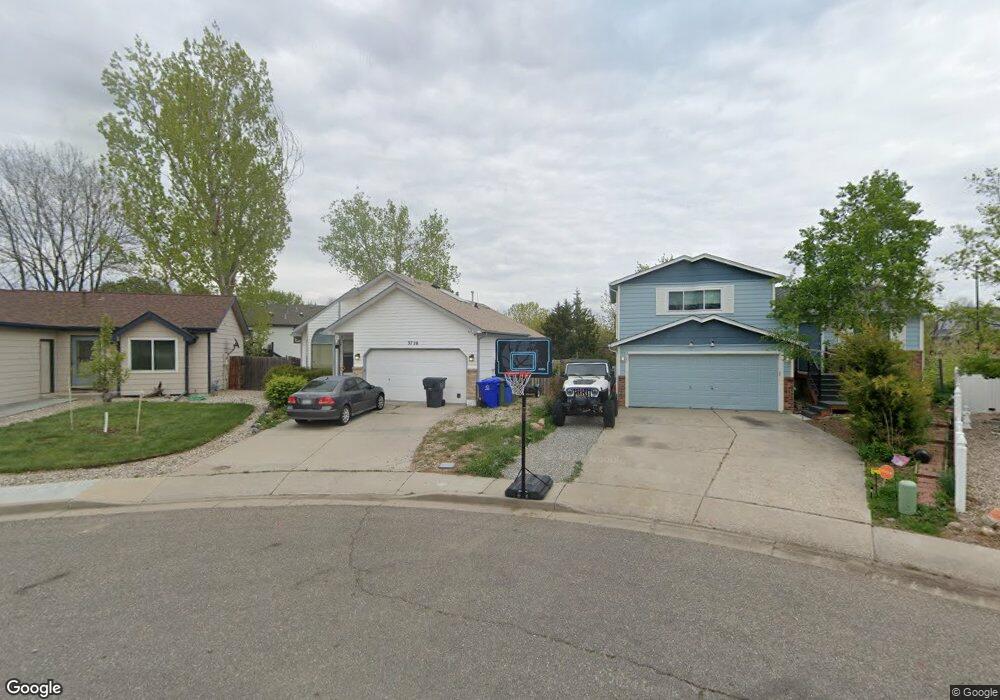
3726 Red Oak Ct Loveland, CO 80538
Estimated Value: $400,000 - $428,000
3
Beds
2
Baths
1,060
Sq Ft
$394/Sq Ft
Est. Value
About This Home
This home is located at 3726 Red Oak Ct, Loveland, CO 80538 and is currently estimated at $417,983, approximately $394 per square foot. 3726 Red Oak Ct is a home located in Larimer County with nearby schools including Peakview Academy at Conrad Ball, Stansberry Elementary School, and Mountain View High School.
Ownership History
Date
Name
Owned For
Owner Type
Purchase Details
Closed on
Apr 13, 2012
Sold by
Barrett Darin W and Barrett Frances I
Bought by
Standiford Aimee L
Current Estimated Value
Home Financials for this Owner
Home Financials are based on the most recent Mortgage that was taken out on this home.
Original Mortgage
$3,730
Outstanding Balance
$2,333
Interest Rate
2%
Mortgage Type
Unknown
Estimated Equity
$415,650
Purchase Details
Closed on
Jan 22, 2002
Sold by
Reeves Maxine L
Bought by
Barrett Darin W and Barrett Frances I
Home Financials for this Owner
Home Financials are based on the most recent Mortgage that was taken out on this home.
Original Mortgage
$125,600
Interest Rate
7.07%
Purchase Details
Closed on
Sep 1, 1992
Sold by
Parham Bryan
Bought by
Reeves William C
Purchase Details
Closed on
Mar 1, 1992
Sold by
Sadler Judy J By Aif
Bought by
Tefft Jack D
Create a Home Valuation Report for This Property
The Home Valuation Report is an in-depth analysis detailing your home's value as well as a comparison with similar homes in the area
Home Values in the Area
Average Home Value in this Area
Purchase History
| Date | Buyer | Sale Price | Title Company |
|---|---|---|---|
| Standiford Aimee L | $157,000 | Unified Title Company Of Nor | |
| Barrett Darin W | $157,000 | Security Title | |
| Barrett Darin W | -- | -- | |
| Reeves William C | $74,200 | -- | |
| Tefft Jack D | $10,000 | -- |
Source: Public Records
Mortgage History
| Date | Status | Borrower | Loan Amount |
|---|---|---|---|
| Open | Standiford Aimee L | $3,730 | |
| Open | Standiford Aimee L | $153,020 | |
| Previous Owner | Barrett Darin W | $125,600 |
Source: Public Records
Tax History Compared to Growth
Tax History
| Year | Tax Paid | Tax Assessment Tax Assessment Total Assessment is a certain percentage of the fair market value that is determined by local assessors to be the total taxable value of land and additions on the property. | Land | Improvement |
|---|---|---|---|---|
| 2025 | $1,827 | $26,579 | $7,906 | $18,673 |
| 2024 | $1,762 | $26,579 | $7,906 | $18,673 |
| 2022 | $1,603 | $20,149 | $2,294 | $17,855 |
| 2021 | $1,647 | $20,728 | $2,360 | $18,368 |
| 2020 | $1,500 | $18,869 | $2,360 | $16,509 |
| 2019 | $1,475 | $18,869 | $2,360 | $16,509 |
| 2018 | $1,258 | $15,286 | $2,376 | $12,910 |
| 2017 | $1,083 | $15,286 | $2,376 | $12,910 |
| 2016 | $1,022 | $13,938 | $2,627 | $11,311 |
| 2015 | $1,014 | $13,940 | $2,630 | $11,310 |
| 2014 | $911 | $12,110 | $2,630 | $9,480 |
Source: Public Records
Map
Nearby Homes
- 4108 N Garfield Ave Unit 20
- 171 E 42nd St Unit C
- 119 E 42nd St Unit 3B
- 4105 N Garfield Ave Unit 100
- 4105 N Garfield Ave Unit 61
- 324 Sagewood Dr
- 3244 Hawthorn Dr
- 3638 Butternut Dr Unit 7A
- 4342 Sunridge Dr
- 3321 Butternut Dr
- 4453 N Lincoln Ave
- 3750 Sheridan Ave
- 502 Honey Locust Dr
- 4386 Suncreek Dr
- 367 Limber Place
- 3523 N Franklin Ave
- 3402 White Ash Ct
- 126 Juniper Place
- 138 Juniper Place
- 127 Juniper Place
- 3722 Red Oak Ct
- 3730 Red Oak Ct
- 3727 Black Oak Ct
- 3720 Red Oak Ct
- 0 Red Oak Ct
- 3715 Black Oak Ct
- 3733 Black Oak Ct
- 3723 Red Oak Ct
- 3738 Red Oak Ct
- 3739 Black Oak Ct
- 3727 Red Oak Ct
- 3714 Black Oak Ct
- 3731 Red Oak Ct
- 3735 Red Oak Ct
- 3739 Red Oak Ct
- 3720 Black Oak Ct
- 3726 Black Oak Ct
- 3732 Black Oak Ct
- 228 Elder Dr
- 3738 Black Oak Ct