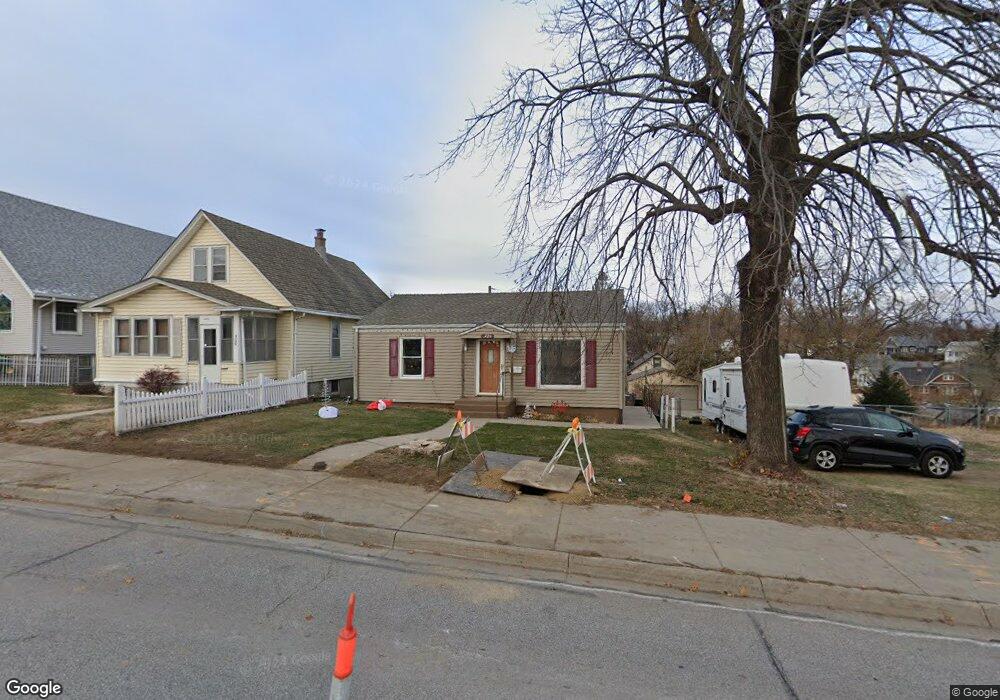
3726 S 13th St Omaha, NE 68107
South Central Omaha NeighborhoodEstimated Value: $135,000 - $178,000
2
Beds
1
Bath
768
Sq Ft
$200/Sq Ft
Est. Value
About This Home
This home is located at 3726 S 13th St, Omaha, NE 68107 and is currently estimated at $153,523, approximately $199 per square foot. 3726 S 13th St is a home located in Douglas County with nearby schools including Spring Lake Magnet Center, R.M. Marrs Magnet Middle School, and South High School.
Ownership History
Date
Name
Owned For
Owner Type
Purchase Details
Closed on
Sep 12, 2024
Sold by
Marchese Fred S
Bought by
Rodriquez Ryan Joseph
Current Estimated Value
Home Financials for this Owner
Home Financials are based on the most recent Mortgage that was taken out on this home.
Original Mortgage
$160,115
Outstanding Balance
$158,322
Interest Rate
6.49%
Mortgage Type
VA
Estimated Equity
-$4,799
Purchase Details
Closed on
Dec 19, 2014
Sold by
Merriman Denise M
Bought by
Marchese Fred S and Merriman Denise M
Create a Home Valuation Report for This Property
The Home Valuation Report is an in-depth analysis detailing your home's value as well as a comparison with similar homes in the area
Home Values in the Area
Average Home Value in this Area
Purchase History
| Date | Buyer | Sale Price | Title Company |
|---|---|---|---|
| Rodriquez Ryan Joseph | $155,000 | Dri Title & Escrow | |
| Marchese Fred S | $32,000 | None Available |
Source: Public Records
Mortgage History
| Date | Status | Borrower | Loan Amount |
|---|---|---|---|
| Open | Rodriquez Ryan Joseph | $160,115 |
Source: Public Records
Tax History Compared to Growth
Tax History
| Year | Tax Paid | Tax Assessment Tax Assessment Total Assessment is a certain percentage of the fair market value that is determined by local assessors to be the total taxable value of land and additions on the property. | Land | Improvement |
|---|---|---|---|---|
| 2024 | -- | $125,000 | $14,700 | $110,300 |
| 2023 | -- | $100,400 | $14,700 | $85,700 |
| 2022 | $0 | $94,200 | $8,500 | $85,700 |
| 2021 | $1,571 | $74,200 | $8,500 | $65,700 |
| 2020 | $1,589 | $74,200 | $8,500 | $65,700 |
| 2019 | $1,456 | $67,800 | $8,500 | $59,300 |
| 2018 | $1,297 | $60,300 | $8,500 | $51,800 |
| 2017 | $1,366 | $63,200 | $4,400 | $58,800 |
| 2016 | $1,356 | $63,200 | $4,400 | $58,800 |
| 2015 | $1,338 | $63,200 | $4,400 | $58,800 |
| 2014 | $1,338 | $63,200 | $4,400 | $58,800 |
Source: Public Records
Map
Nearby Homes