3727 E F St Tacoma, WA 98404
Eastside NeighborhoodEstimated Value: $333,014 - $354,000
2
Beds
1
Bath
692
Sq Ft
$503/Sq Ft
Est. Value
About This Home
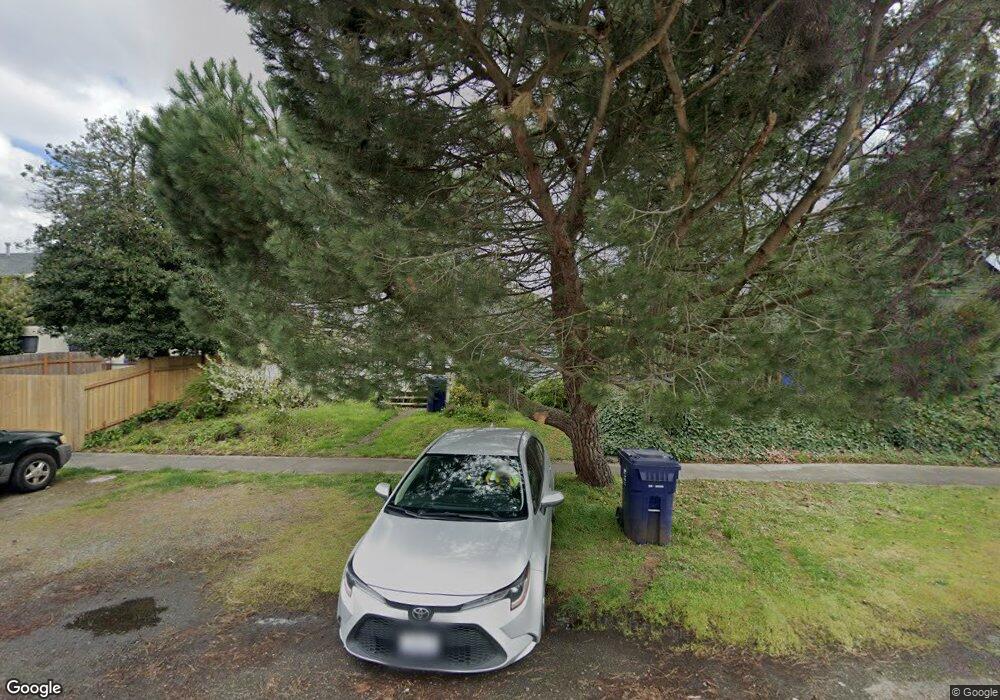
This home is located at 3727 E F St, Tacoma, WA 98404 and is currently estimated at $348,004, approximately $502 per square foot. 3727 E F St is a home located in Pierce County with nearby schools including Blix Elementary School, Hunt Middle School, and Lincoln High School.
Ownership History
Date
Name
Owned For
Owner Type
Purchase Details
Closed on
Apr 5, 2018
Sold by
Williams Blake
Bought by
Robertson Nancie
Current Estimated Value
Purchase Details
Closed on
Jan 25, 2017
Sold by
Fox Larry W
Bought by
Williams Blake
Purchase Details
Closed on
Jan 20, 2017
Sold by
Fox Larry W
Bought by
Williams Blake
Purchase Details
Closed on
Nov 14, 2016
Sold by
Fox Charles E
Bought by
Fox Larry W
Purchase Details
Closed on
Jun 29, 1996
Sold by
Foy Larry W
Bought by
Hogan Margaret
Create a Home Valuation Report for This Property
The Home Valuation Report is an in-depth analysis detailing your home's value as well as a comparison with similar homes in the area
Home Values in the Area
Average Home Value in this Area
Purchase History
| Date | Buyer | Sale Price | Title Company |
|---|---|---|---|
| Robertson Nancie | $19,300 | None Available | |
| Williams Blake | -- | Rainier Title | |
| Williams Blake | -- | None Available | |
| Fox Larry W | -- | Accommodation | |
| Hogan Margaret | -- | -- |
Source: Public Records
Tax History Compared to Growth
Tax History
| Year | Tax Paid | Tax Assessment Tax Assessment Total Assessment is a certain percentage of the fair market value that is determined by local assessors to be the total taxable value of land and additions on the property. | Land | Improvement |
|---|---|---|---|---|
| 2025 | $2,822 | $278,200 | $184,500 | $93,700 |
| 2024 | $2,822 | $275,300 | $177,500 | $97,800 |
| 2023 | $2,822 | $253,000 | $165,400 | $87,600 |
| 2022 | $2,551 | $263,200 | $164,600 | $98,600 |
| 2021 | $2,247 | $178,300 | $102,900 | $75,400 |
| 2019 | $1,790 | $158,000 | $85,700 | $72,300 |
| 2018 | $1,834 | $137,300 | $68,600 | $68,700 |
| 2017 | $1,591 | $115,800 | $52,700 | $63,100 |
| 2016 | $1,410 | $84,900 | $39,200 | $45,700 |
| 2014 | $1,250 | $80,900 | $38,100 | $42,800 |
| 2013 | $1,250 | $71,300 | $33,400 | $37,900 |
Source: Public Records
Map
Nearby Homes